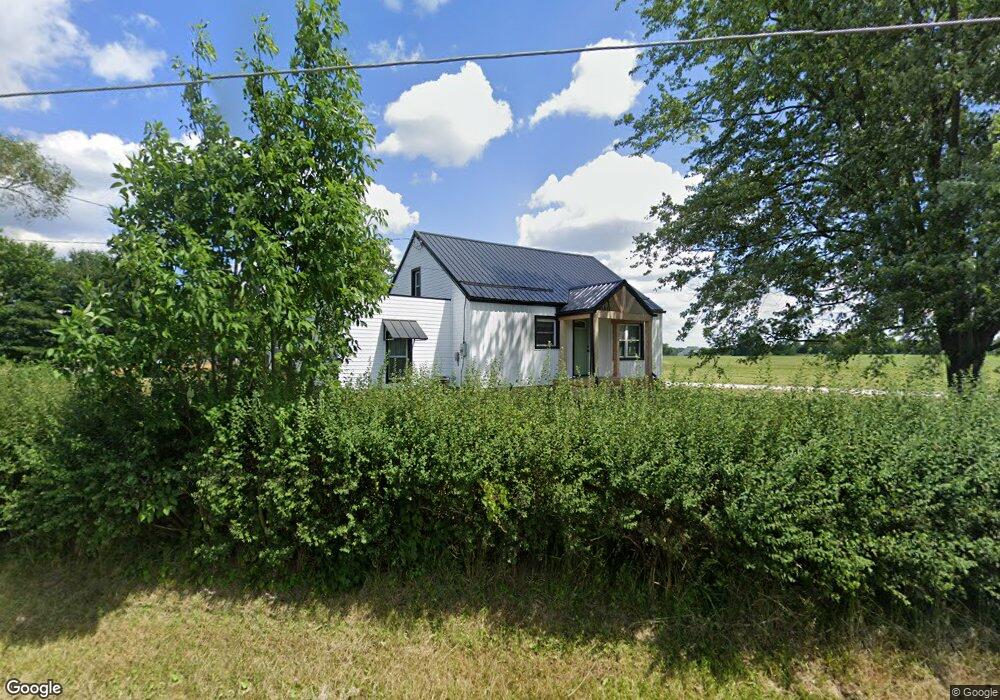
10440 Columbus Rd NE Louisville, OH 44641
Estimated Value: $259,000 - $284,000
2
Beds
1
Bath
1,434
Sq Ft
$190/Sq Ft
Est. Value
About This Home
This home is located at 10440 Columbus Rd NE, Louisville, OH 44641 and is currently estimated at $271,847, approximately $189 per square foot. 10440 Columbus Rd NE is a home located in Stark County with nearby schools including Marlington High School.
Ownership History
Date
Name
Owned For
Owner Type
Purchase Details
Closed on
Jun 4, 2024
Sold by
Long Ryan S
Bought by
Maclean Brandon D and Maclean Sarah E
Current Estimated Value
Home Financials for this Owner
Home Financials are based on the most recent Mortgage that was taken out on this home.
Original Mortgage
$6,747
Outstanding Balance
$6,529
Interest Rate
1.7%
Estimated Equity
$265,318
Purchase Details
Closed on
Jul 2, 2017
Sold by
Blasiman Debra L
Bought by
Williams Jane M
Home Financials for this Owner
Home Financials are based on the most recent Mortgage that was taken out on this home.
Original Mortgage
$125,460
Interest Rate
3.94%
Mortgage Type
Unknown
Purchase Details
Closed on
Jun 6, 2017
Sold by
Williams Jane M
Bought by
Long Ryan S
Home Financials for this Owner
Home Financials are based on the most recent Mortgage that was taken out on this home.
Original Mortgage
$125,460
Interest Rate
3.94%
Mortgage Type
Unknown
Purchase Details
Closed on
Jan 17, 2014
Sold by
Williams Dennis W and Williams Jane M
Bought by
Williams Dennis W and Williams Jane M
Create a Home Valuation Report for This Property
The Home Valuation Report is an in-depth analysis detailing your home's value as well as a comparison with similar homes in the area
Home Values in the Area
Average Home Value in this Area
Purchase History
| Date | Buyer | Sale Price | Title Company |
|---|---|---|---|
| Maclean Brandon D | $269,900 | Heritage Union Title | |
| Williams Jane M | -- | None Available | |
| Long Ryan S | $147,600 | None Available | |
| Williams Dennis W | -- | None Available |
Source: Public Records
Mortgage History
| Date | Status | Borrower | Loan Amount |
|---|---|---|---|
| Open | Maclean Brandon D | $6,747 | |
| Open | Maclean Brandon D | $261,803 | |
| Previous Owner | Long Ryan S | $125,460 |
Source: Public Records
Tax History Compared to Growth
Tax History
| Year | Tax Paid | Tax Assessment Tax Assessment Total Assessment is a certain percentage of the fair market value that is determined by local assessors to be the total taxable value of land and additions on the property. | Land | Improvement |
|---|---|---|---|---|
| 2025 | -- | $70,880 | $15,260 | $55,620 |
| 2024 | -- | $70,880 | $15,260 | $55,620 |
| 2023 | $1,292 | $40,215 | $14,805 | $25,410 |
| 2022 | $1,261 | $34,130 | $9,660 | $24,470 |
| 2021 | $1,265 | $34,130 | $9,660 | $24,470 |
| 2020 | $1,155 | $28,670 | $8,510 | $20,160 |
| 2019 | $1,151 | $28,700 | $8,520 | $20,180 |
| 2018 | $1,100 | $28,700 | $8,520 | $20,180 |
| 2017 | $665 | $24,780 | $8,170 | $16,610 |
| 2016 | $595 | $23,070 | $8,170 | $14,900 |
| 2015 | $595 | $23,070 | $8,170 | $14,900 |
| 2014 | $795 | $26,320 | $11,420 | $14,900 |
| 2013 | $389 | $26,320 | $11,420 | $14,900 |
Source: Public Records
Map
Nearby Homes
- 0 Reeder Ave NE
- 10666 Wilma Ave NE
- 12355 Edison St NE
- 13334 Cindy St NE
- 2377 Ansley St Unit 2377
- 0 Meadow St NE
- 11960 Freshley Ave NE
- 1430 Westwood Ave
- 2851 Patriots Path Unit 3D
- 12415 Snode St NE
- 2435 Queensbury Rd
- 2081 Marwood Cir
- 0 Valewood Cir Unit 5006281
- 13109 Edison St NE
- 11480 Aebi Ave NE
- 0 W Main St Unit 5090123
- 7844 Morningstar Dr
- 0 Easton St NE
- 000 Klinger Ave
- 1201 Overlook Dr
- 10440 Columbus Rd NE
- 10375 Columbus Rd NE
- 10455 Columbus Rd
- 10364 Columbus Rd NE
- 10211 Reeder Ave
- 10344 Columbus Rd
- 10199 Reeder Ave
- 10199 Reeder Ave
- 10514 Columbus Rd
- 10087 Reeder Ave
- 10306 Columbus Rd
- 10353 Reeder Ave
- 10304 Reeder Ave
- 10265 Columbus Rd NE
- 10240 Columbus Rd
- 10418 Beeson St NE
- 9911 Reeder Ave
- 10225 Columbus Rd NE
- 9999 Reeder Ave
- 10205 Columbus Rd NE