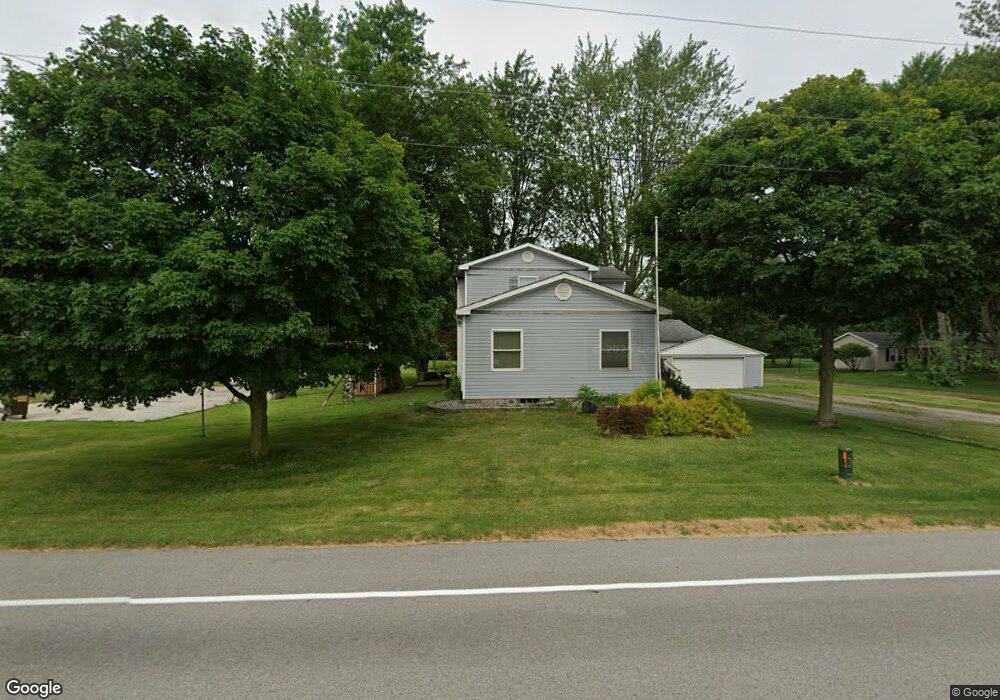
10440 Providence-Neapolis-swanton Rd Grand Rapids, OH 43522
West Lucas County Neighborhood
4
Beds
2
Baths
2,400
Sq Ft
1.51
Acres
About This Home
This home is located at 10440 Providence-Neapolis-swanton Rd, Grand Rapids, OH 43522. 10440 Providence-Neapolis-swanton Rd is a home located in Lucas County with nearby schools including Otsego Elementary School, Otsego Junior High School, and Otsego High School.
Ownership History
Date
Name
Owned For
Owner Type
Purchase Details
Closed on
May 15, 2017
Sold by
Speegle Aaron
Bought by
Calkins Jared L and Calkins Samantha R
Home Financials for this Owner
Home Financials are based on the most recent Mortgage that was taken out on this home.
Original Mortgage
$216,015
Outstanding Balance
$179,953
Interest Rate
4.25%
Mortgage Type
FHA
Purchase Details
Closed on
Dec 8, 2015
Sold by
Prentice Rick L
Bought by
Speegle Aaron
Home Financials for this Owner
Home Financials are based on the most recent Mortgage that was taken out on this home.
Original Mortgage
$155,250
Interest Rate
3.92%
Mortgage Type
New Conventional
Purchase Details
Closed on
Jul 8, 1997
Sold by
Price Gregory A
Bought by
Prentice Rick L
Home Financials for this Owner
Home Financials are based on the most recent Mortgage that was taken out on this home.
Original Mortgage
$70,200
Interest Rate
8.01%
Mortgage Type
New Conventional
Purchase Details
Closed on
Jan 17, 1989
Sold by
White Harley F
Create a Home Valuation Report for This Property
The Home Valuation Report is an in-depth analysis detailing your home's value as well as a comparison with similar homes in the area
Home Values in the Area
Average Home Value in this Area
Purchase History
| Date | Buyer | Sale Price | Title Company |
|---|---|---|---|
| Calkins Jared L | $220,000 | None Available | |
| Speegle Aaron | $172,500 | Vantage Point Title Inc | |
| Prentice Rick L | $78,000 | -- | |
| -- | $42,900 | -- |
Source: Public Records
Mortgage History
| Date | Status | Borrower | Loan Amount |
|---|---|---|---|
| Open | Calkins Jared L | $216,015 | |
| Closed | Speegle Aaron | $155,250 | |
| Previous Owner | Prentice Rick L | $70,200 |
Source: Public Records
Tax History Compared to Growth
Tax History
| Year | Tax Paid | Tax Assessment Tax Assessment Total Assessment is a certain percentage of the fair market value that is determined by local assessors to be the total taxable value of land and additions on the property. | Land | Improvement |
|---|---|---|---|---|
| 2024 | $1,417 | $59,745 | $15,750 | $43,995 |
| 2023 | $2,035 | $40,425 | $8,750 | $31,675 |
| 2022 | $2,061 | $40,425 | $8,750 | $31,675 |
| 2021 | $1,827 | $35,875 | $8,750 | $27,125 |
| 2020 | $1,568 | $28,945 | $7,035 | $21,910 |
| 2019 | $1,529 | $28,945 | $7,035 | $21,910 |
| 2018 | $1,348 | $28,945 | $7,035 | $21,910 |
| 2017 | $1,288 | $24,500 | $5,950 | $18,550 |
| 2016 | $1,240 | $70,000 | $17,000 | $53,000 |
| 2015 | $1,249 | $70,000 | $17,000 | $53,000 |
| 2014 | $1,280 | $24,050 | $5,850 | $18,200 |
| 2013 | $1,280 | $24,050 | $5,850 | $18,200 |
Source: Public Records
Map
Nearby Homes
- 9100 Prov Neap Swan Rd
- 0 Jeffers Rd
- U344 County Road 2
- U266 County Road 2
- U330 Co Rd 2
- 8808 Jeffers Rd
- 0 Manore Lot A Rd Unit 6130402
- 0 Manore Lot B Rd Unit 6130403
- 970 County Road 3
- 23763 Front St
- 23912 E 2nd St
- 24432 W 3rd St
- 24537 W 3rd St
- 17630 Woodburn Ave
- 8314 Manore Rd
- 3466 County Road V
- S261 County Road 4
- 600 North St
- 11130 Doran Rd
- Q081 3a County Rd
- 10440 Prov Neap Swan Rd
- 10440 Providence Neapolis Swan Rd
- 10438 Prov Neap Swan Rd
- 10438 Providence-Neapolis-swanton Rd
- 10510 Prov Neap Swan Rd
- 14015 Box Rd
- 14049 Box Rd
- 14093 Box Rd
- 13901 Box Rd
- 10605 Prov Neap Swan Rd
- 10606 Prov Neap Swan Rd
- 10605 Providence-Neapolis-swanton Rd
- 10616 Prov Neap Swan Rd
- 10616 Providence Neapolis Swan Rd
- 10605 Providence Neapolis Rd
- 14201 Box Rd
- 10630 Prov Neap Swan Rd
- 10650 Prov Neap Swan Rd
- 10708 Prov Neap Swan Rd
- 10223 Prov Neap Swan Rd