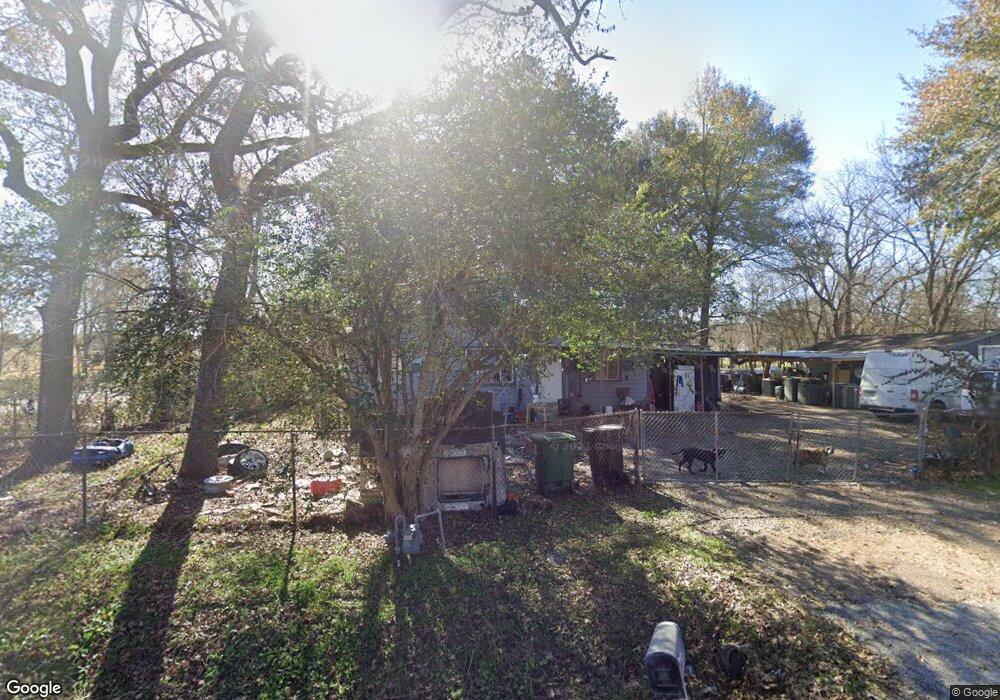
10446 Bantum St Houston, TX 77093
Eastex-Jensen NeighborhoodEstimated Value: $177,000 - $265,000
2
Beds
1
Bath
1,112
Sq Ft
$209/Sq Ft
Est. Value
About This Home
This home is located at 10446 Bantum St, Houston, TX 77093 and is currently estimated at $231,930, approximately $208 per square foot. 10446 Bantum St is a home located in Harris County with nearby schools including Coop Elementary School, Patrick Henry Middle School, and Sam Houston Math, Science & Technology Center.
Ownership History
Date
Name
Owned For
Owner Type
Purchase Details
Closed on
Mar 11, 2013
Sold by
Pat Hooker & Associates Llc
Bought by
Sanchez Raul De Jesus and Ramos Francisco M
Current Estimated Value
Purchase Details
Closed on
Mar 12, 2001
Sold by
Shipman Wannetta Levern and Shipman Wannetta L
Bought by
Cook Louise M
Purchase Details
Closed on
Dec 1, 2000
Sold by
Shipman Wannetta Levern
Bought by
Shipman Wannetta Levern and Shipman Wannetta L
Create a Home Valuation Report for This Property
The Home Valuation Report is an in-depth analysis detailing your home's value as well as a comparison with similar homes in the area
Home Values in the Area
Average Home Value in this Area
Purchase History
| Date | Buyer | Sale Price | Title Company |
|---|---|---|---|
| Sanchez Raul De Jesus | -- | None Available | |
| Pat Hoker & Associaties Llc | -- | None Available | |
| Cook Louise M | -- | -- | |
| Shipman Wannetta Levern | -- | -- |
Source: Public Records
Tax History Compared to Growth
Tax History
| Year | Tax Paid | Tax Assessment Tax Assessment Total Assessment is a certain percentage of the fair market value that is determined by local assessors to be the total taxable value of land and additions on the property. | Land | Improvement |
|---|---|---|---|---|
| 2025 | $4,938 | $230,517 | $178,191 | $52,326 |
| 2024 | $4,938 | $244,473 | $166,891 | $77,582 |
| 2023 | $3,963 | $196,687 | $130,384 | $66,303 |
| 2022 | $3,565 | $161,924 | $108,653 | $53,271 |
| 2021 | $2,945 | $126,375 | $78,230 | $48,145 |
| 2020 | $2,959 | $122,176 | $78,230 | $43,946 |
| 2019 | $3,092 | $122,176 | $78,230 | $43,946 |
| 2018 | $2,281 | $90,135 | $59,977 | $30,158 |
| 2017 | $2,279 | $90,135 | $59,977 | $30,158 |
| 2016 | $2,279 | $90,135 | $59,977 | $30,158 |
| 2015 | $1,863 | $72,474 | $40,245 | $32,229 |
| 2014 | $1,863 | $72,474 | $40,245 | $32,229 |
Source: Public Records
Map
Nearby Homes
- 2415 Goodloe St
- 2332 Margaret St
- 2315 Langley Rd
- 2318 Cresline St
- 2633 Hollis St
- 3202 Parker Rd
- 1728 Little York Rd
- 1904 Little York Rd
- 4918 Langley Rd
- 2636 Lone Oak Rd
- 2629 Kowis St
- 3709 Gager St
- 10512 Exeter St
- 10514 Exeter St
- 1829 Skinner Rd
- 1908 Little York Rd
- 2122 Kowis St
- 2817 Cromwell St
- 2152 William Tell St
- 1731 Schilder Dr
- 10434 Bantum St
- 2637 Charles Rd
- 2635 Charles Rd
- 10414 Shady Ln
- 10410 Shady Ln
- 10439 Bantum St
- 10422 Shady Ln
- 10441 Bantum St
- 10435 Bantum St
- 10447 Bantum St
- 10431 Bantum St
- 2327 Charles Rd
- 10418 Bantum St
- 10426 Shady Ln
- 10415 Carlington Dr
- 10427 Bantum St
- 10419 Carlington Dr
- 10426 Bantum St
- 10402 Shady Ln
- 2623 Charles Rd