Estimated Value: $177,224 - $222,000
3
Beds
4
Baths
1,164
Sq Ft
$170/Sq Ft
Est. Value
About This Home
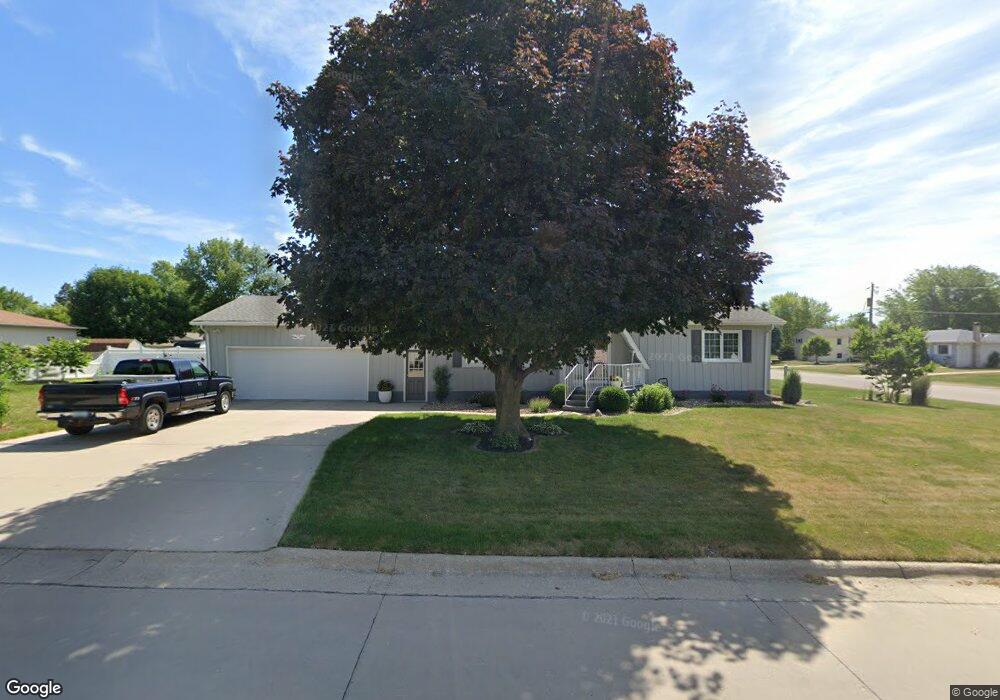
This home is located at 1045 3rd St, Jesup, IA 50648 and is currently estimated at $197,556, approximately $169 per square foot. 1045 3rd St is a home located in Buchanan County with nearby schools including Jesup Elementary School, Jesup Middle School, and Jesup High School.
Create a Home Valuation Report for This Property
The Home Valuation Report is an in-depth analysis detailing your home's value as well as a comparison with similar homes in the area
Home Values in the Area
Average Home Value in this Area
Tax History
| Year | Tax Paid | Tax Assessment Tax Assessment Total Assessment is a certain percentage of the fair market value that is determined by local assessors to be the total taxable value of land and additions on the property. | Land | Improvement |
|---|---|---|---|---|
| 2025 | $2,410 | $185,290 | $29,530 | $155,760 |
| 2024 | $2,410 | $164,020 | $26,370 | $137,650 |
| 2023 | $2,450 | $164,020 | $26,370 | $137,650 |
| 2022 | $2,540 | $137,550 | $20,930 | $116,620 |
| 2021 | $2,464 | $137,550 | $20,930 | $116,620 |
| 2020 | $2,464 | $126,470 | $19,180 | $107,290 |
| 2019 | $2,404 | $126,470 | $19,180 | $107,290 |
| 2018 | $2,276 | $123,200 | $19,180 | $104,020 |
| 2017 | $2,222 | $123,200 | $19,180 | $104,020 |
| 2016 | $2,166 | $118,380 | $12,970 | $105,410 |
| 2015 | $2,166 | $118,380 | $12,970 | $105,410 |
| 2014 | $2,202 | $118,380 | $12,970 | $105,410 |
Source: Public Records
Map
Nearby Homes
- 1124 3rd St
- 1225 1st St
- 1634 Dalton St
- 1644 Killarney Dr
- Lot 7 Dalton St
- 524 Christopher Cir
- 235 Bordner Dr
- 1555 Dalton St
- 1645 Dalton St
- 915 Young St
- 1655 Dalton St
- 435 5th St
- 1225 10th St
- 0 220th St
- 414 Main St
- Lot 4 Benson Shady Grove Ave
- Lot 2 Benson Shady Grove Ave
- Lot 1 Benson Shady Grove Ave
- 814 Duroe St
- 0 Benson Ridge Addition Unit Lot 7
Your Personal Tour Guide
Ask me questions while you tour the home.