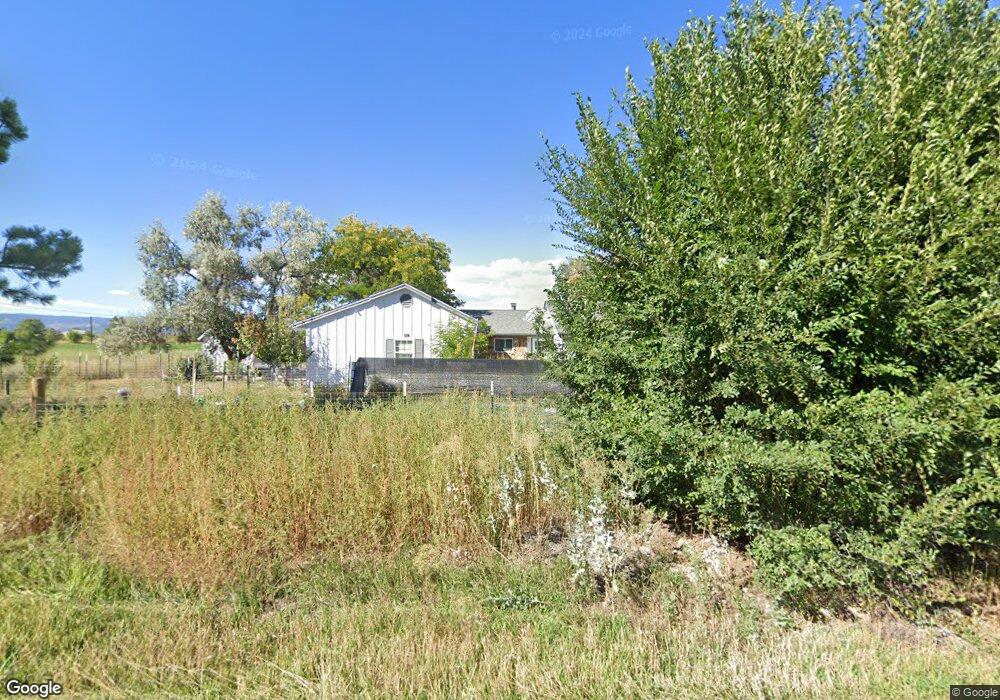
1045 3rd St Penrose, CO 81240
Estimated Value: $431,021 - $538,000
4
Beds
3
Baths
1,774
Sq Ft
$276/Sq Ft
Est. Value
About This Home
This home is located at 1045 3rd St, Penrose, CO 81240 and is currently estimated at $489,755, approximately $276 per square foot. 1045 3rd St is a home located in Fremont County with nearby schools including Penrose Elementary School and Florence High School.
Ownership History
Date
Name
Owned For
Owner Type
Purchase Details
Closed on
Feb 22, 2021
Sold by
Marr Family Trust
Bought by
Madaminov Khurshed and Madaminov Masuma
Current Estimated Value
Home Financials for this Owner
Home Financials are based on the most recent Mortgage that was taken out on this home.
Original Mortgage
$411,810
Outstanding Balance
$368,319
Interest Rate
2.7%
Mortgage Type
VA
Estimated Equity
$121,436
Purchase Details
Closed on
Jul 24, 2017
Sold by
Marr Robert E and Marr Sharon M
Bought by
Marr Family Trust
Create a Home Valuation Report for This Property
The Home Valuation Report is an in-depth analysis detailing your home's value as well as a comparison with similar homes in the area
Home Values in the Area
Average Home Value in this Area
Purchase History
| Date | Buyer | Sale Price | Title Company |
|---|---|---|---|
| Madaminov Khurshed | $397,500 | Fidelity National Title | |
| Marr Family Trust | -- | None Available |
Source: Public Records
Mortgage History
| Date | Status | Borrower | Loan Amount |
|---|---|---|---|
| Open | Madaminov Khurshed | $411,810 |
Source: Public Records
Tax History
| Year | Tax Paid | Tax Assessment Tax Assessment Total Assessment is a certain percentage of the fair market value that is determined by local assessors to be the total taxable value of land and additions on the property. | Land | Improvement |
|---|---|---|---|---|
| 2024 | $2,150 | $30,324 | $0 | $0 |
| 2023 | $1,923 | $21,980 | $0 | $0 |
| 2022 | $1,506 | $20,653 | $0 | $0 |
| 2021 | $1,012 | $21,248 | $0 | $0 |
| 2020 | $682 | $18,253 | $0 | $0 |
| 2019 | $685 | $18,253 | $0 | $0 |
| 2018 | $538 | $15,942 | $0 | $0 |
| 2017 | $548 | $15,942 | $0 | $0 |
| 2016 | $580 | $17,350 | $0 | $0 |
| 2015 | $1,058 | $17,350 | $0 | $0 |
| 2012 | $1,139 | $17,233 | $6,766 | $10,467 |
Source: Public Records
Map
Nearby Homes
- 1183 2nd St
- 215 Sherrill Dr
- TBD J St
- TBD County Road 123
- 875 7th St
- 730 6th St
- 15900 Vietnam Veterans Memorial Hwy
- 1574 4th St
- 18530 Colorado 115
- 909 K St
- 708 Fremont St
- 358 Illinois St
- 555 D St
- 312 Fremont Ave
- 611 Q St
- 205 Illinois St
- 15941 Vietnam Veterans Memorial Hwy
- 207 Fremont St
- 747 D St
- 958 L St
Your Personal Tour Guide
Ask me questions while you tour the home.