Estimated Value: $522,000 - $1,045,000
2
Beds
3
Baths
2,827
Sq Ft
$275/Sq Ft
Est. Value
About This Home
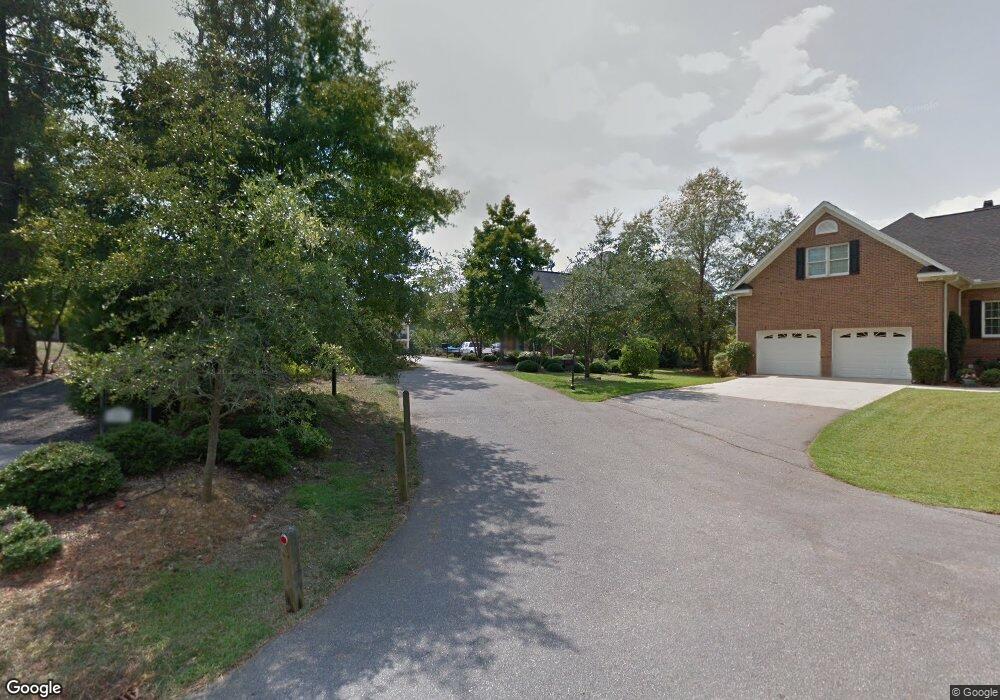
This home is located at 1045 Carl Shealy Rd, Irmo, SC 29063 and is currently estimated at $778,286, approximately $275 per square foot. 1045 Carl Shealy Rd is a home located in Richland County with nearby schools including Ballentine Elementary School, Dutch Fork Middle School, and Dutch Fork High School.
Ownership History
Date
Name
Owned For
Owner Type
Purchase Details
Closed on
Sep 17, 2014
Sold by
Brooks Jane C
Bought by
Brooks Jane C and Jane C Brooks Revocable Trust
Current Estimated Value
Purchase Details
Closed on
Mar 27, 2014
Sold by
Altman James E
Bought by
Brooks Jane C
Purchase Details
Closed on
Oct 19, 2001
Sold by
Alizio Joseph A and Alizio Theda C
Bought by
Altman James E
Home Financials for this Owner
Home Financials are based on the most recent Mortgage that was taken out on this home.
Original Mortgage
$361,500
Interest Rate
6.85%
Purchase Details
Closed on
Aug 17, 2001
Sold by
Bowers R Hal
Bought by
Alizio Joseph A and Alizio Theda C
Home Financials for this Owner
Home Financials are based on the most recent Mortgage that was taken out on this home.
Original Mortgage
$215,707
Interest Rate
7.08%
Create a Home Valuation Report for This Property
The Home Valuation Report is an in-depth analysis detailing your home's value as well as a comparison with similar homes in the area
Home Values in the Area
Average Home Value in this Area
Purchase History
| Date | Buyer | Sale Price | Title Company |
|---|---|---|---|
| Brooks Jane C | -- | -- | |
| Brooks Jane C | $315,000 | None Available | |
| Altman James E | $245,000 | -- | |
| Alizio Joseph A | $238,000 | -- |
Source: Public Records
Mortgage History
| Date | Status | Borrower | Loan Amount |
|---|---|---|---|
| Previous Owner | Altman James E | $361,500 | |
| Previous Owner | Alizio Joseph A | $215,707 |
Source: Public Records
Tax History Compared to Growth
Tax History
| Year | Tax Paid | Tax Assessment Tax Assessment Total Assessment is a certain percentage of the fair market value that is determined by local assessors to be the total taxable value of land and additions on the property. | Land | Improvement |
|---|---|---|---|---|
| 2024 | $6,351 | $916,500 | $0 | $0 |
| 2023 | $6,351 | $31,880 | $0 | $0 |
| 2022 | $5,428 | $797,000 | $356,800 | $440,200 |
| 2021 | $5,548 | $31,880 | $0 | $0 |
| 2020 | $5,837 | $31,880 | $0 | $0 |
| 2019 | $5,871 | $31,880 | $0 | $0 |
| 2018 | $4,527 | $27,720 | $0 | $0 |
| 2017 | $4,397 | $27,720 | $0 | $0 |
| 2016 | $4,373 | $27,720 | $0 | $0 |
| 2015 | $1,959 | $12,600 | $0 | $0 |
| 2014 | $6,045 | $247,000 | $0 | $0 |
| 2013 | -- | $14,820 | $0 | $0 |
Source: Public Records
Map
Nearby Homes
- 514 Shadowood Dr
- 200 Derrick Dr
- 261 Murray Falls Ln
- 287 Murray Falls Ln
- 1 Circle Dr
- 1034 Gates Rd
- 297 Wahoo Cir
- 180 Wahoo Cir
- 103 Harbors Mist Dr
- 105 Harbors Mist Dr
- 110 Signal Ln
- 4 Bamboo Grove Ct
- 115 Beacon Point Rd
- 319 Sienna Dr
- 1008 Jones Rd
- 552 Eagles Rest Dr
- 121 Cove View Dr
- 00 Bickley Rd
- 1909 Marina Rd
- 124 Cove Ct
- 1049 Carl Shealy Rd
- 1041 Carl Shealy Rd
- 1057 Carl Shealy Rd
- 1037 Carl Shealy Rd
- 1037 Carl Shealy Rd
- 1046 Carl Shealy Rd
- 220 Twin Gates Rd
- 224 Twin Gates Rd
- 226 Twin Gates Rd
- 218 Twin Gates Rd
- 228 Twin Gates Rd
- 230 Twin Gates Rd
- 521 Shadowood Dr
- 231 Twin Gates Rd
- 525 Shadowood Dr
- 551 Shadowood Dr
- 529 Shadowood Dr
- 1023 Carl Shealy Rd
- 10 Angel Pointe
- 10 Angel Point