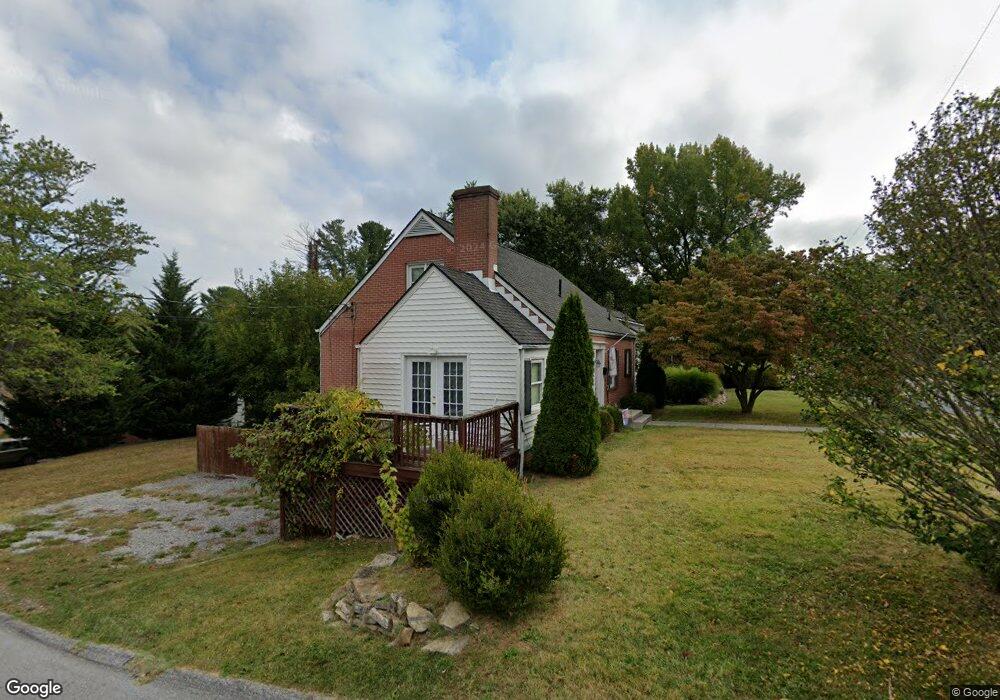
1045 Lyndhurst Rd Waynesboro, VA 22980
Estimated Value: $301,000 - $320,000
3
Beds
2
Baths
1,650
Sq Ft
$188/Sq Ft
Est. Value
About This Home
This home is located at 1045 Lyndhurst Rd, Waynesboro, VA 22980 and is currently estimated at $310,113, approximately $187 per square foot. 1045 Lyndhurst Rd is a home located in Waynesboro City with nearby schools including Berkeley Glenn Elementary School, Kate Collins Middle School, and Waynesboro High School.
Ownership History
Date
Name
Owned For
Owner Type
Purchase Details
Closed on
Feb 14, 2018
Sold by
Kirtz Richard W and Kirtz Abigail A
Bought by
Johnson Leslie M
Current Estimated Value
Home Financials for this Owner
Home Financials are based on the most recent Mortgage that was taken out on this home.
Original Mortgage
$181,717
Outstanding Balance
$153,898
Interest Rate
3.99%
Mortgage Type
New Conventional
Estimated Equity
$156,215
Purchase Details
Closed on
Oct 5, 2009
Sold by
Humphreys William J
Bought by
Kirtz Richard W
Home Financials for this Owner
Home Financials are based on the most recent Mortgage that was taken out on this home.
Original Mortgage
$173,367
Interest Rate
5.12%
Mortgage Type
New Conventional
Purchase Details
Closed on
Apr 2, 2009
Sold by
Bank Of Ny Mellon Tr Co
Bought by
Humphreys William J
Purchase Details
Closed on
Feb 26, 2009
Sold by
Specialized Inc Of Va Sub Tr and Duncan Martin B
Bought by
Bank Of Ny Mellon Tr Co
Create a Home Valuation Report for This Property
The Home Valuation Report is an in-depth analysis detailing your home's value as well as a comparison with similar homes in the area
Home Values in the Area
Average Home Value in this Area
Purchase History
| Date | Buyer | Sale Price | Title Company |
|---|---|---|---|
| Johnson Leslie M | $179,900 | Attorney | |
| Kirtz Richard W | $169,900 | -- | |
| Humphreys William J | $85,000 | -- | |
| Bank Of Ny Mellon Tr Co | $112,395 | -- |
Source: Public Records
Mortgage History
| Date | Status | Borrower | Loan Amount |
|---|---|---|---|
| Open | Johnson Leslie M | $181,717 | |
| Previous Owner | Bank Of Ny Mellon Tr Co | $173,367 |
Source: Public Records
Tax History Compared to Growth
Tax History
| Year | Tax Paid | Tax Assessment Tax Assessment Total Assessment is a certain percentage of the fair market value that is determined by local assessors to be the total taxable value of land and additions on the property. | Land | Improvement |
|---|---|---|---|---|
| 2025 | $2,368 | $288,800 | $57,500 | $231,300 |
| 2024 | $1,918 | $249,100 | $52,500 | $196,600 |
| 2023 | $1,918 | $249,100 | $52,500 | $196,600 |
| 2022 | $1,724 | $191,600 | $48,500 | $143,100 |
| 2021 | $1,724 | $191,600 | $48,500 | $143,100 |
| 2020 | $1,645 | $182,800 | $48,500 | $134,300 |
| 2019 | $1,645 | $182,800 | $48,500 | $134,300 |
| 2018 | $1,313 | $145,900 | $48,500 | $97,400 |
| 2017 | $1,262 | $145,100 | $48,500 | $96,600 |
| 2016 | $1,162 | $145,300 | $48,500 | $96,800 |
| 2015 | $1,162 | $145,300 | $48,500 | $96,800 |
| 2014 | -- | $144,000 | $48,500 | $95,500 |
| 2013 | -- | $0 | $0 | $0 |
Source: Public Records
Map
Nearby Homes
- 844 Lyndhurst Rd
- 833 Jefferson Ave
- 645 Maple Ave
- 705 Oak Ave
- 701 Western Rd
- 548 Pine Ave
- 477 Chestnut Ave
- 1358 Keesling Ave
- 314 13th St
- 528 Arch Ave
- 529 S Linden Ave
- 1215 W 12th St
- 373 S Magnolia Ave
- 812 Meadowbrook Rd
- 407 Crompton Rd
- 1220 Chatham Rd
- 636 Rosser Ave
- 1013 Ohio St
- 1637 Mulberry St
- 28 Little Chestnut Ln
- 1043 Lyndhurst Rd
- 109 Valley Rd
- 1055 Lyndhurst Rd
- 1037 Lyndhurst Rd
- 113 Valley Rd
- 108 Valley Rd
- 1059 Lyndhurst Rd
- 112 Valley Rd
- 1048 Lyndhurst Rd
- 1042 Lyndhurst Rd
- 117 Valley Rd
- 1054 Lyndhurst Rd
- 1063 Lyndhurst Rd
- 116 Valley Rd
- 1029 Lyndhurst Rd
- 1030 Lyndhurst Rd
- 1060 Lyndhurst Rd
- 109 River Rd
- 1067 Lyndhurst Rd
- 113 River Rd