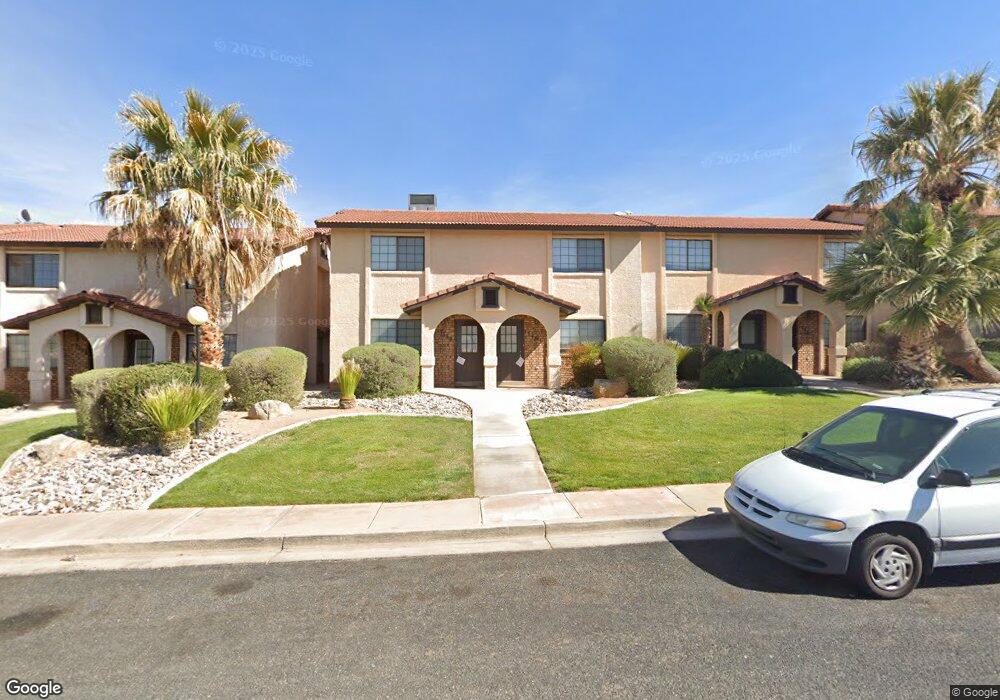
1045 N 1725 W Unit 164 Saint George, UT 84770
Estimated Value: $211,000 - $245,000
2
Beds
2
Baths
1,054
Sq Ft
$221/Sq Ft
Est. Value
About This Home
This home is located at 1045 N 1725 W Unit 164, Saint George, UT 84770 and is currently estimated at $232,962, approximately $221 per square foot. 1045 N 1725 W Unit 164 is a home located in Washington County with nearby schools including Paradise Canyon, Snow Canyon Middle School, and Lava Ridge Intermediate School.
Ownership History
Date
Name
Owned For
Owner Type
Purchase Details
Closed on
Aug 19, 2021
Sold by
Chipman Christopher and Wilkes Morgan
Bought by
Chipman Christopher Jon and Chipman Morgan Eliza
Current Estimated Value
Home Financials for this Owner
Home Financials are based on the most recent Mortgage that was taken out on this home.
Original Mortgage
$126,000
Outstanding Balance
$114,573
Interest Rate
2.9%
Mortgage Type
New Conventional
Estimated Equity
$118,389
Purchase Details
Closed on
May 29, 2018
Sold by
Alexander Sehila W
Bought by
Chipman Christopher and Wilkes Morgan
Home Financials for this Owner
Home Financials are based on the most recent Mortgage that was taken out on this home.
Original Mortgage
$129,980
Interest Rate
4.4%
Mortgage Type
New Conventional
Purchase Details
Closed on
Apr 19, 2013
Sold by
Warner Donna Mae
Bought by
Warner Donna Mae and The Donna Mae Warner Trust
Create a Home Valuation Report for This Property
The Home Valuation Report is an in-depth analysis detailing your home's value as well as a comparison with similar homes in the area
Home Values in the Area
Average Home Value in this Area
Purchase History
| Date | Buyer | Sale Price | Title Company |
|---|---|---|---|
| Chipman Christopher Jon | -- | Accommodation | |
| Chipman Christopher | -- | Sutherland Title Co | |
| Warner Donna Mae | -- | Sutherland Title Company |
Source: Public Records
Mortgage History
| Date | Status | Borrower | Loan Amount |
|---|---|---|---|
| Open | Chipman Christopher Jon | $126,000 | |
| Closed | Chipman Christopher | $129,980 |
Source: Public Records
Tax History Compared to Growth
Tax History
| Year | Tax Paid | Tax Assessment Tax Assessment Total Assessment is a certain percentage of the fair market value that is determined by local assessors to be the total taxable value of land and additions on the property. | Land | Improvement |
|---|---|---|---|---|
| 2025 | $953 | $137,335 | $30,250 | $107,085 |
| 2023 | $934 | $139,480 | $27,500 | $111,980 |
| 2022 | $949 | $133,375 | $27,500 | $105,875 |
| 2021 | $807 | $169,000 | $35,000 | $134,000 |
| 2020 | $738 | $145,700 | $30,000 | $115,700 |
| 2019 | $710 | $136,800 | $30,000 | $106,800 |
| 2018 | $710 | $68,585 | $0 | $0 |
| 2017 | $613 | $59,290 | $0 | $0 |
| 2016 | $556 | $49,665 | $0 | $0 |
| 2015 | $571 | $49,005 | $0 | $0 |
| 2014 | $534 | $46,090 | $0 | $0 |
Source: Public Records
Map
Nearby Homes
- 1782 W 1020 N Unit 133
- 1742 W 1020 N Unit 123
- 1840 W 1100 N Unit 28
- 1840 W 1100 N Unit 17
- 1840 W 1100 N Unit 55
- 1708 W 1020 N Unit 146
- 1793 W 950 N Unit 3
- 954 N 1725 W Unit 32
- 1811 W 1300 N
- 1589 W 1270 N
- 1542 W 1270 N
- 1225 N Dixie Downs Rd Unit 29
- 1225 N Dixie Downs Rd Unit 103
- 1225 N Dixie Downs Rd Unit 52
- 1225 N Dixie Downs Rd Unit 16
- 1225 N Dixie Downs Rd Unit 42
- 1225 N Dixie Downs Rd Unit 136
- 1225 N Dixie Downs Rd Unit 69
- 1225 N Dixie Downs Rd Unit 100
- 1360 N Dixie Downs Rd Unit 5
- 1045 N 1725 W Unit 176
- 1045 N 1725 W Unit 175
- 1045 N 1725 W Unit 174
- 1045 N 1725 W Unit 173
- 1045 N 1725 W Unit 172
- 1045 N 1725 W Unit 171
- 1045 N 1725 W Unit 170
- 1045 N 1725 W Unit 169
- 1045 N 1725 W Unit 168
- 1045 N 1725 W Unit 166
- 1045 N 1725 W Unit 165
- 1045 N 1725 W Unit 162
- 1045 N 1725 W Unit 161
- 1045 N 1725 W Unit 160
- 1045 N 1725 W Unit 159
- 1045 N 1725 W Unit 158
- 1045 N 1725 W Unit 157
- 1045 N 1725 W Unit 155
- 1045 N 1725 W Unit 154
- 1045 N 1725 W Unit 153