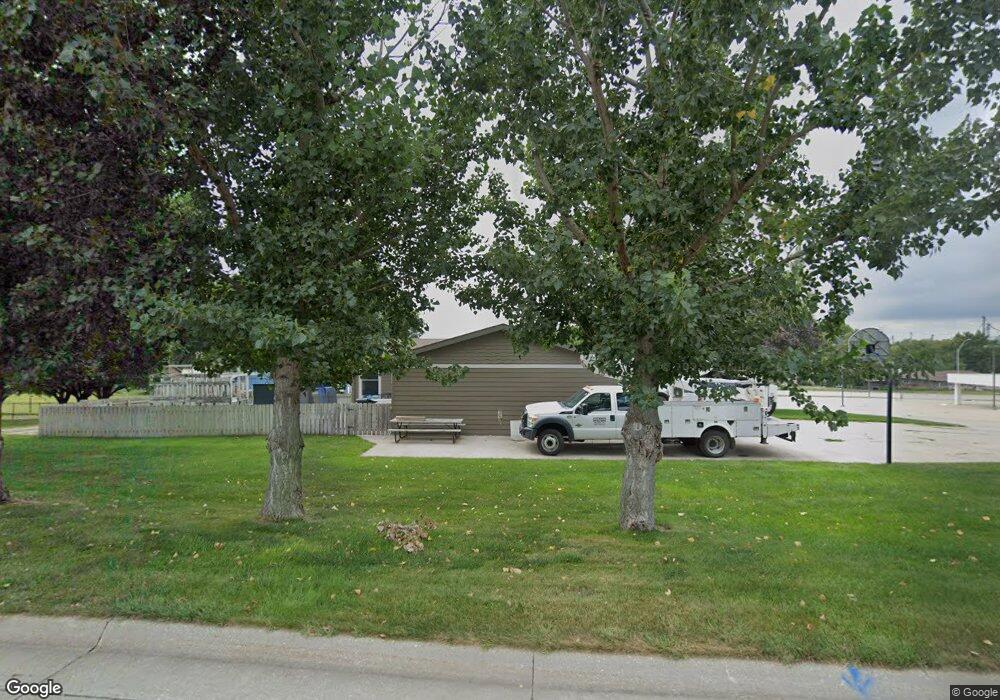
1045 N Colfax St West Point, NE 68788
Estimated Value: $264,698 - $334,000
--
Bed
1
Bath
1,548
Sq Ft
$184/Sq Ft
Est. Value
About This Home
This home is located at 1045 N Colfax St, West Point, NE 68788 and is currently estimated at $284,925, approximately $184 per square foot. 1045 N Colfax St is a home located in Cuming County with nearby schools including West Point-Beemer Junior/Senior High School, Guardian Angels Elementary School, and St. Paul Lutheran School.
Ownership History
Date
Name
Owned For
Owner Type
Purchase Details
Closed on
Oct 6, 2015
Sold by
Race John D and Race Lisa A
Bought by
Spenner Arron Z and Johnson Kylie J
Current Estimated Value
Home Financials for this Owner
Home Financials are based on the most recent Mortgage that was taken out on this home.
Original Mortgage
$133,500
Outstanding Balance
$104,675
Interest Rate
3.94%
Mortgage Type
New Conventional
Estimated Equity
$180,250
Purchase Details
Closed on
Jun 2, 2008
Sold by
Mcelroy James W and Mcelroy Jane M
Bought by
Race John D and Race Lisa A
Home Financials for this Owner
Home Financials are based on the most recent Mortgage that was taken out on this home.
Original Mortgage
$106,400
Interest Rate
5.89%
Mortgage Type
New Conventional
Create a Home Valuation Report for This Property
The Home Valuation Report is an in-depth analysis detailing your home's value as well as a comparison with similar homes in the area
Home Values in the Area
Average Home Value in this Area
Purchase History
| Date | Buyer | Sale Price | Title Company |
|---|---|---|---|
| Spenner Arron Z | $179,000 | Stewart Title Company | |
| Race John D | $133,000 | -- |
Source: Public Records
Mortgage History
| Date | Status | Borrower | Loan Amount |
|---|---|---|---|
| Open | Spenner Arron Z | $133,500 | |
| Previous Owner | Race John D | $106,400 |
Source: Public Records
Tax History Compared to Growth
Tax History
| Year | Tax Paid | Tax Assessment Tax Assessment Total Assessment is a certain percentage of the fair market value that is determined by local assessors to be the total taxable value of land and additions on the property. | Land | Improvement |
|---|---|---|---|---|
| 2025 | $2,106 | $265,210 | $35,935 | $229,275 |
| 2024 | $2,106 | $245,670 | $35,935 | $209,735 |
| 2023 | $2,545 | $220,575 | $31,755 | $188,820 |
| 2022 | $2,469 | $195,150 | $25,070 | $170,080 |
| 2021 | $2,301 | $172,745 | $20,895 | $151,850 |
| 2020 | $2,188 | $163,860 | $20,895 | $142,965 |
| 2019 | $2,100 | $153,700 | $20,895 | $132,805 |
| 2018 | $1,892 | $137,830 | $20,895 | $116,935 |
| 2017 | $1,933 | $137,830 | $20,895 | $116,935 |
| 2016 | $1,923 | $133,155 | $20,895 | $112,260 |
| 2015 | $2,047 | $133,155 | $20,895 | $112,260 |
| 2014 | $2,043 | $118,370 | $20,895 | $97,475 |
| 2013 | $2,043 | $118,370 | $20,895 | $97,475 |
Source: Public Records
Map
Nearby Homes
- 1207 N Main St
- 208 N Lincoln St
- 1402 E Bridge St
- 101 S Main St
- 749 E Grove St
- 126 E Grove St
- 420 S Farragut St
- 1045 E Grove St
- 205 E Sheridan St
- 519 S Niphon St
- 626 S Monitor St
- 402 W Pine St
- 301 W Pine St
- 2235 K Rd
- 2416 F Rd
- 1225 Co Road 1
- TBD Oakland
- 134 N Linden St
- 328 N Oakland Ave
- 206 N Thomas Ave
- 1025 N Colfax St
- 1020 N Lincoln St
- 1100 N Colfax St
- 1040 N Lincoln St
- 1004 N Lincoln St
- 247 E Pollock St
- 1111 N Lincoln St
- 1111 N Lincoln St
- 905 N Colfax St
- 302 E Weiler St
- 303 E Weiler St
- 304 E Weiler St
- 305 E Weiler St
- 1141 N Lincoln St
- 341 E Weiler St
- 306 E Weiler St
- 1030 N Main St
- 342 E Weiler St
- 1042 N Main St
- 829 N Colfax St