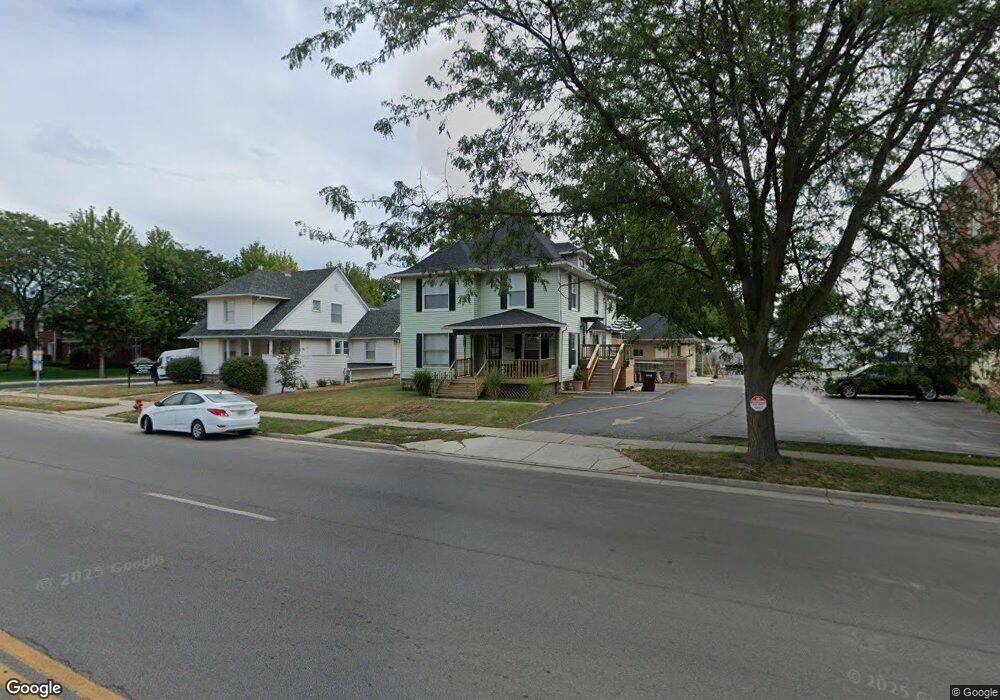
1045 N Main St Findlay, OH 45840
Estimated Value: $160,131 - $192,000
2
Beds
2
Baths
1,904
Sq Ft
$92/Sq Ft
Est. Value
About This Home
This home is located at 1045 N Main St, Findlay, OH 45840 and is currently estimated at $174,283, approximately $91 per square foot. 1045 N Main St is a home located in Hancock County with nearby schools including Whittier Primary School, Bigelow Hill Elementary School, and Glenwood Middle School.
Ownership History
Date
Name
Owned For
Owner Type
Purchase Details
Closed on
Jun 18, 2020
Sold by
Snoke Wendy M and The Estate Of David D Snoke
Bought by
Snoke Harry R
Current Estimated Value
Purchase Details
Closed on
Mar 10, 2011
Sold by
Snoke Family Properties Llc
Bought by
Snoke David D and Snoke Timothy A
Home Financials for this Owner
Home Financials are based on the most recent Mortgage that was taken out on this home.
Original Mortgage
$116,250
Interest Rate
4.85%
Mortgage Type
New Conventional
Purchase Details
Closed on
Oct 1, 2001
Sold by
Fogarty Donald J
Bought by
Snoke H Randall David D
Home Financials for this Owner
Home Financials are based on the most recent Mortgage that was taken out on this home.
Original Mortgage
$129,000
Interest Rate
6.97%
Mortgage Type
New Conventional
Create a Home Valuation Report for This Property
The Home Valuation Report is an in-depth analysis detailing your home's value as well as a comparison with similar homes in the area
Home Values in the Area
Average Home Value in this Area
Purchase History
| Date | Buyer | Sale Price | Title Company |
|---|---|---|---|
| Snoke Harry R | -- | None Available | |
| Snoke David D | -- | Whitman Title | |
| Snoke H Randall David D | $129,000 | -- |
Source: Public Records
Mortgage History
| Date | Status | Borrower | Loan Amount |
|---|---|---|---|
| Previous Owner | Snoke David D | $116,250 | |
| Previous Owner | Snoke H Randall David D | $129,000 |
Source: Public Records
Tax History Compared to Growth
Tax History
| Year | Tax Paid | Tax Assessment Tax Assessment Total Assessment is a certain percentage of the fair market value that is determined by local assessors to be the total taxable value of land and additions on the property. | Land | Improvement |
|---|---|---|---|---|
| 2024 | $1,512 | $41,480 | $5,530 | $35,950 |
| 2023 | $1,515 | $41,480 | $5,530 | $35,950 |
| 2022 | $1,509 | $41,480 | $5,530 | $35,950 |
| 2021 | $1,317 | $31,540 | $5,520 | $26,020 |
| 2020 | $1,317 | $31,540 | $5,520 | $26,020 |
| 2019 | $1,291 | $31,540 | $5,520 | $26,020 |
| 2018 | $1,229 | $27,550 | $4,800 | $22,750 |
| 2017 | $615 | $27,550 | $4,800 | $22,750 |
| 2016 | $1,222 | $27,550 | $4,800 | $22,750 |
| 2015 | $1,164 | $25,890 | $4,800 | $21,090 |
| 2014 | $1,165 | $25,890 | $4,800 | $21,090 |
| 2012 | $1,173 | $25,890 | $4,800 | $21,090 |
Source: Public Records
Map
Nearby Homes
- 1045 N Main St
- 1045 N Main St Unit 1045 Apt B
- 1049 N Main St
- 113 Garfield Ave
- 1041 N Main St
- 115 Garfield Ave
- 114 George St
- 114 George St Unit R
- 1039 N Main St
- 119 Garfield Ave
- 118 George St
- 122 George St
- 123 Garfield Ave
- 1100 N Main St
- 117 George St
- 128 George St
- 120 Garfield Ave
- 125 Garfield Ave
- 119 George St
- 122 Garfield Ave