M
Landlord's Agent in 2025
Mark G Vonder Meulen
AmeriSouth Management, Inc.
(678) 887-3818
Estimated Value: $574,374 - $658,000
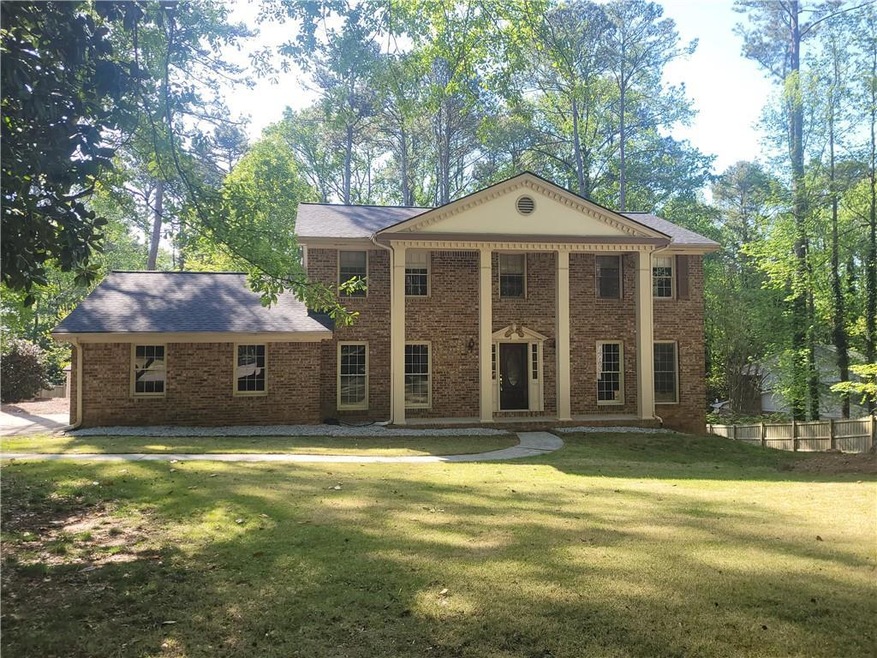
Spacious four-bedroom home with hardwood floors on main level and all bedrooms. All bedrooms have ceiling fans. Living room, family room and separate dining room. Eat-in kitchen with granite countertops and walk-in pantry. Large sunroom with three ceiling fans, tile foor and wood-plank ceiling. Primary bathroom with double vanity, shower with rain shower head. Property is on septic system. Refrigerator provided. Fireplace is decorative only, not working.
**NO CATS ALLOWED**
Last Agent to Rent the Property
AmeriSouth Management, Inc. License #243675 Listed on: 04/15/2025
Last Renter's Agent
AmeriSouth Management, Inc. License #243675 Listed on: 04/15/2025
| Date | Buyer | Sale Price | Title Company |
|---|---|---|---|
| Stuart David G | $340,000 | -- |
| Date | Status | Borrower | Loan Amount |
|---|---|---|---|
| Open | Stuart David G | $272,000 |
| Date | Event | Price | List to Sale | Price per Sq Ft | Prior Sale |
|---|---|---|---|---|---|
| 04/18/2025 04/18/25 | Rented | $3,600 | 0.0% | -- | |
| 04/15/2025 04/15/25 | For Rent | $3,600 | +24.1% | -- | |
| 08/04/2022 08/04/22 | Rented | $2,900 | 0.0% | -- | |
| 07/27/2022 07/27/22 | For Rent | $2,900 | 0.0% | -- | |
| 05/05/2017 05/05/17 | Sold | $340,000 | -6.8% | $152 / Sq Ft | View Prior Sale |
| 04/04/2017 04/04/17 | Pending | -- | -- | -- | |
| 03/21/2017 03/21/17 | Price Changed | $365,000 | -3.9% | $163 / Sq Ft | |
| 03/14/2017 03/14/17 | For Sale | $380,000 | -- | $170 / Sq Ft |
| Year | Tax Paid | Tax Assessment Tax Assessment Total Assessment is a certain percentage of the fair market value that is determined by local assessors to be the total taxable value of land and additions on the property. | Land | Improvement |
|---|---|---|---|---|
| 2025 | $713 | $170,160 | $39,760 | $130,400 |
| 2023 | $713 | $162,960 | $34,920 | $128,040 |
| 2022 | $3,076 | $162,960 | $34,920 | $128,040 |
| 2021 | $3,653 | $150,360 | $31,240 | $119,120 |
| 2020 | $3,700 | $134,200 | $30,200 | $104,000 |
| 2019 | $609 | $122,880 | $22,360 | $100,520 |
| 2018 | $3,387 | $120,000 | $21,840 | $98,160 |
| 2017 | $2,077 | $91,160 | $15,880 | $75,280 |
| 2016 | $2,076 | $91,160 | $15,880 | $75,280 |
| 2015 | $2,577 | $91,160 | $15,880 | $75,280 |
| 2014 | $2,150 | $91,160 | $15,880 | $75,280 |
M
Landlord's Agent in 2025
Mark G Vonder Meulen
AmeriSouth Management, Inc.
(678) 887-3818

Seller's Agent in 2017
Joe Ruggles
New South Residential, LLC
(404) 585-7653
4 in this area
43 Total Sales
Buyer's Agent in 2017
Yvette Waterson
HomeSmart
(770) 881-1395
13 Total Sales
Source: First Multiple Listing Service (FMLS)
MLS Number: 7560456
APN: 12-1611-0268-014-2
Disclaimer: Certain information contained herein is derived from information provided by parties other than Homes.com. All information provided is deemed reliable, but is not guaranteed to be accurate and should be independently verified.
![]() Listings identified with the FMLS IDX logo come from FMLS and are held by brokerage firms other than the owner of this website. The listing brokerage is identified in any listing details. Information is deemed reliable but is not guaranteed. If you believe any FMLS listing contains material that infringes your copyrighted work please visit www.fmls.com/dmca to review our DMCA policy and learn how to submit a takedown request. © 2025 First Multiple Listing Service, Inc.
Listings identified with the FMLS IDX logo come from FMLS and are held by brokerage firms other than the owner of this website. The listing brokerage is identified in any listing details. Information is deemed reliable but is not guaranteed. If you believe any FMLS listing contains material that infringes your copyrighted work please visit www.fmls.com/dmca to review our DMCA policy and learn how to submit a takedown request. © 2025 First Multiple Listing Service, Inc.