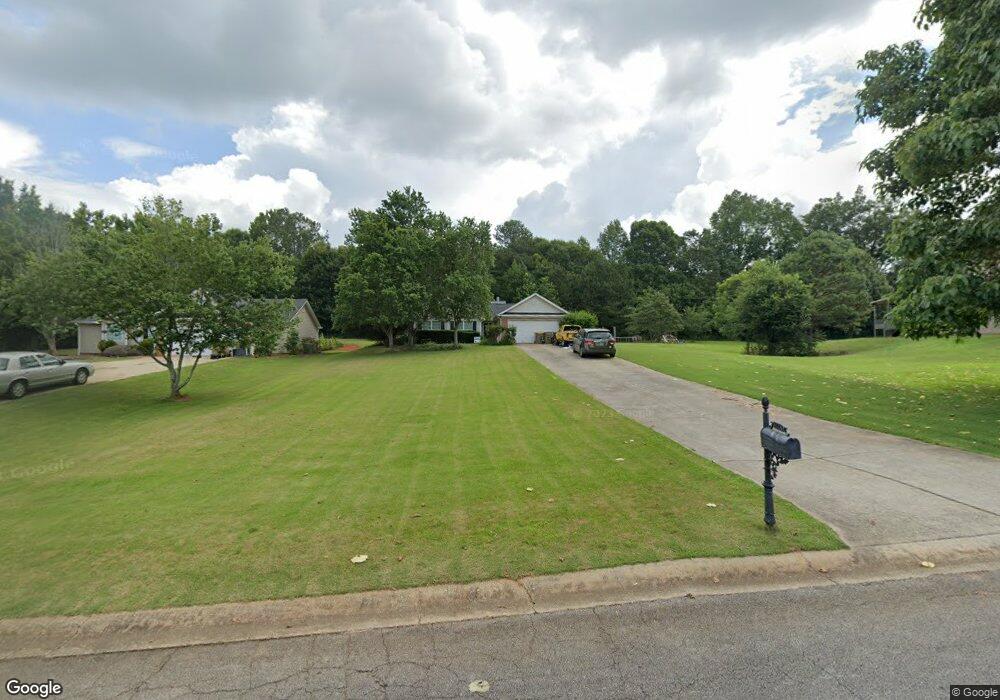
1045 Octavia Ct Unit LOT 9 Winder, GA 30680
Estimated Value: $305,000 - $321,000
3
Beds
2
Baths
1,279
Sq Ft
$245/Sq Ft
Est. Value
About This Home
This home is located at 1045 Octavia Ct Unit LOT 9, Winder, GA 30680 and is currently estimated at $312,846, approximately $244 per square foot. 1045 Octavia Ct Unit LOT 9 is a home located in Barrow County with nearby schools including Bethlehem Elementary School, Haymon-Morris Middle School, and Apalachee High School.
Ownership History
Date
Name
Owned For
Owner Type
Purchase Details
Closed on
Jun 20, 2008
Sold by
Federal Home Loan Mortgage Corporation
Bought by
Whaley Derek A and Thompson-Whaley Jennifer
Current Estimated Value
Home Financials for this Owner
Home Financials are based on the most recent Mortgage that was taken out on this home.
Original Mortgage
$108,145
Outstanding Balance
$70,173
Interest Rate
6.27%
Mortgage Type
FHA
Estimated Equity
$242,673
Purchase Details
Closed on
Apr 1, 2008
Sold by
Wells Fargo Bk Na
Bought by
Federal Home Loan Mortgage Corporation
Purchase Details
Closed on
Nov 18, 2004
Sold by
Elmo Fortenberry Builder Inc
Bought by
Bulman Elizabeth
Home Financials for this Owner
Home Financials are based on the most recent Mortgage that was taken out on this home.
Original Mortgage
$103,844
Interest Rate
5.66%
Mortgage Type
New Conventional
Purchase Details
Closed on
Mar 15, 2004
Sold by
Rural Designs Llc
Bought by
Elmo Fortenberry Builder Inc
Home Financials for this Owner
Home Financials are based on the most recent Mortgage that was taken out on this home.
Original Mortgage
$104,925
Interest Rate
5.62%
Purchase Details
Closed on
Sep 24, 2003
Bought by
Rural Designs Llc
Create a Home Valuation Report for This Property
The Home Valuation Report is an in-depth analysis detailing your home's value as well as a comparison with similar homes in the area
Home Values in the Area
Average Home Value in this Area
Purchase History
| Date | Buyer | Sale Price | Title Company |
|---|---|---|---|
| Whaley Derek A | -- | -- | |
| Federal Home Loan Mortgage Corporation | -- | -- | |
| Wells Fargo Bk Na | $119,332 | -- | |
| Bulman Elizabeth | $118,900 | -- | |
| Elmo Fortenberry Builder Inc | $32,000 | -- | |
| Rural Designs Llc | -- | -- |
Source: Public Records
Mortgage History
| Date | Status | Borrower | Loan Amount |
|---|---|---|---|
| Open | Whaley Derek A | $108,145 | |
| Previous Owner | Bulman Elizabeth | $103,844 | |
| Previous Owner | Elmo Fortenberry Builder Inc | $104,925 |
Source: Public Records
Tax History Compared to Growth
Tax History
| Year | Tax Paid | Tax Assessment Tax Assessment Total Assessment is a certain percentage of the fair market value that is determined by local assessors to be the total taxable value of land and additions on the property. | Land | Improvement |
|---|---|---|---|---|
| 2024 | $2,430 | $98,614 | $24,000 | $74,614 |
| 2023 | $2,028 | $99,214 | $24,000 | $75,214 |
| 2022 | $1,945 | $68,484 | $16,000 | $52,484 |
| 2021 | $2,045 | $68,484 | $16,000 | $52,484 |
| 2020 | $1,715 | $57,366 | $16,000 | $41,366 |
| 2019 | $1,744 | $57,366 | $16,000 | $41,366 |
| 2018 | $1,576 | $54,966 | $13,600 | $41,366 |
| 2017 | $1,246 | $42,787 | $13,600 | $29,187 |
| 2016 | $1,187 | $43,108 | $13,600 | $29,508 |
| 2015 | $1,202 | $43,429 | $13,600 | $29,829 |
| 2014 | $1,020 | $37,206 | $7,056 | $30,150 |
| 2013 | -- | $35,735 | $7,056 | $28,679 |
Source: Public Records
Map
Nearby Homes
- 868 Smith Mill Rd
- 84 Morningdale Cir
- 890 Smith Mill Rd
- 1221 Casper Ln
- 986 Austin Rd
- 264 Westminster Ct
- 258 Westminster Ct
- 938 Austin Rd
- 140 Westminster Ct
- 101 Westminster Ct
- 1 Us 53 Hwy
- 1211 Hog Mountain Rd
- 1216 Austin Rd
- 1210 Austin Rd
- 112 Shallow Way
- 296 Westminster Trail
- 131 Wallace Dr
- 0 Perkins Rd Unit 10623675
- 0 Perkins Rd Unit 7664605
- 1045 Octavia Ct
- 1043 Octavia Ct Unit LOT 8
- 1043 Octavia Ct
- 1049 Octavia Ct
- 0 Octavia Ct Unit 7498516
- 0 Octavia Ct Unit 7438721
- 0 Octavia Ct Unit 7416295
- 0 Octavia Ct Unit 7366014
- 0 Octavia Ct Unit 8276325
- 0 Octavia Ct Unit 8043762
- 0 Octavia Ct Unit 7403638
- 1041 Octavia Ct Unit LOT 7
- 1041 Octavia Ct
- 1041 Octavia Ct Unit 1
- 1053 Octavia Ct
- 1039 Octavia Ct Unit LOT 6
- 1039 Octavia Ct
- 1048 Octavia Ct
- 1044 Octavia Ct Unit LOT 21
- 1044 Octavia Ct