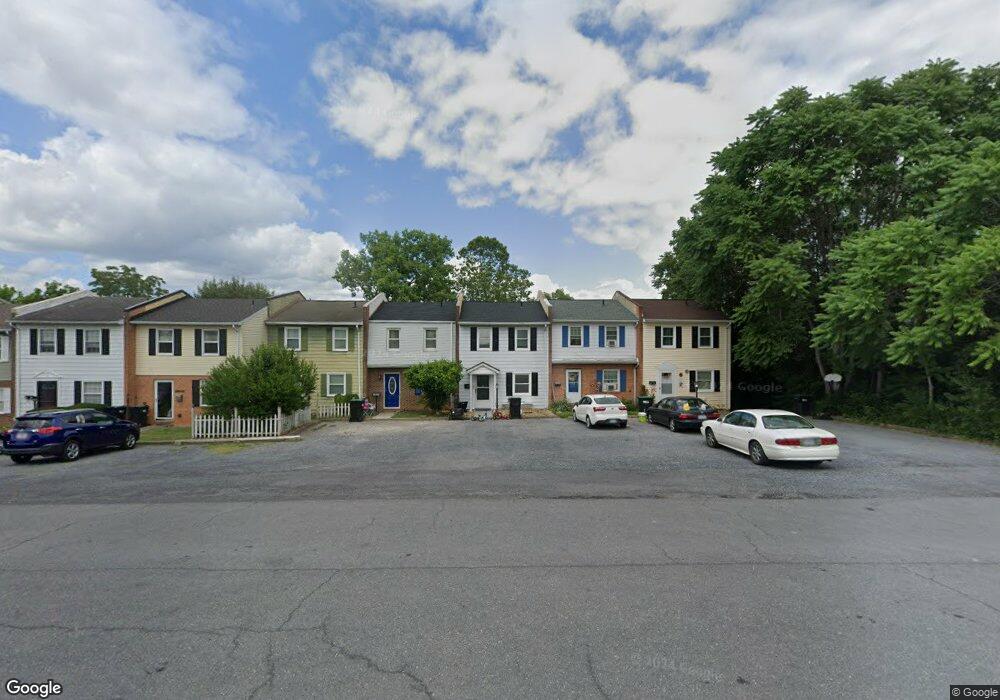
1045 S Main St Unit C8 Woodstock, VA 22664
Estimated Value: $178,000 - $194,000
3
Beds
2
Baths
1,000
Sq Ft
$184/Sq Ft
Est. Value
About This Home
This home is located at 1045 S Main St Unit C8, Woodstock, VA 22664 and is currently estimated at $183,872, approximately $183 per square foot. 1045 S Main St Unit C8 is a home located in Shenandoah County with nearby schools including W.W. Robinson Elementary School, Peter Muhlenberg Middle School, and Central High School.
Ownership History
Date
Name
Owned For
Owner Type
Purchase Details
Closed on
Dec 21, 2023
Sold by
Hunt Cory R and Hunt Kayla N
Bought by
Davis Tracy Jo
Current Estimated Value
Purchase Details
Closed on
May 17, 2016
Sold by
Purdy Nicholas and Purdy Valerie
Bought by
Hunt Cory R and Monse Kayla
Home Financials for this Owner
Home Financials are based on the most recent Mortgage that was taken out on this home.
Original Mortgage
$109,511
Interest Rate
3.59%
Mortgage Type
New Conventional
Purchase Details
Closed on
Aug 25, 2008
Sold by
Goff Kathleen Marie
Bought by
Purdy Nicholas and Purdy Valerie
Home Financials for this Owner
Home Financials are based on the most recent Mortgage that was taken out on this home.
Original Mortgage
$124,624
Interest Rate
6.58%
Mortgage Type
FHA
Create a Home Valuation Report for This Property
The Home Valuation Report is an in-depth analysis detailing your home's value as well as a comparison with similar homes in the area
Home Values in the Area
Average Home Value in this Area
Purchase History
| Date | Buyer | Sale Price | Title Company |
|---|---|---|---|
| Davis Tracy Jo | $160,000 | Old Republic National Title | |
| Hunt Cory R | $106,500 | None Available | |
| Purdy Nicholas | $126,000 | Commonwealth Land Title Insu |
Source: Public Records
Mortgage History
| Date | Status | Borrower | Loan Amount |
|---|---|---|---|
| Previous Owner | Hunt Cory R | $109,511 | |
| Previous Owner | Purdy Nicholas | $124,624 |
Source: Public Records
Tax History Compared to Growth
Tax History
| Year | Tax Paid | Tax Assessment Tax Assessment Total Assessment is a certain percentage of the fair market value that is determined by local assessors to be the total taxable value of land and additions on the property. | Land | Improvement |
|---|---|---|---|---|
| 2025 | $795 | $124,200 | $32,000 | $92,200 |
| 2024 | $795 | $124,200 | $32,000 | $92,200 |
| 2023 | $745 | $124,200 | $32,000 | $92,200 |
| 2022 | $720 | $124,200 | $32,000 | $92,200 |
| 2021 | $611 | $88,500 | $24,000 | $64,500 |
| 2020 | $566 | $88,500 | $24,000 | $64,500 |
| 2019 | $566 | $88,500 | $24,000 | $64,500 |
| 2018 | $566 | $88,500 | $24,000 | $64,500 |
| 2017 | $531 | $88,500 | $24,000 | $64,500 |
| 2016 | $531 | $88,500 | $24,000 | $64,500 |
| 2015 | -- | $91,600 | $26,000 | $65,600 |
| 2014 | -- | $91,600 | $26,000 | $65,600 |
Source: Public Records
Map
Nearby Homes
- 0 W Reservoir Rd Unit VASH2007744
- 151 E Reservoir Rd
- LOT 3 S Main St
- LOT 1 S Main St
- TBD S Main St
- 248 Parkside Ct
- 250 Parkside Ct
- 252 Parkside Ct
- 1282 A12 Ox Rd
- 1282 Ox Rd Unit A-12
- 414 Jefferson St
- 1290 Ox Rd Unit E3
- 756 Spring Pkwy
- 714 Jackson St
- 336 Hollingsworth Rd
- 326 Hollingsworth Rd
- 605 Cedar Ct
- 615 Allegheny Cir
- 628 Allegheny Cir
- 301 S Church St
- 1045 S Main St Unit A-1
- 1045 S Main St Unit C11
- 1045 S Main St Unit C10
- 1045 S Main St Unit C9
- 1045 S Main St Unit C7
- 1045 S Main St Unit C6
- 1045 S Main St Unit C5
- 1045 S Main St Unit C4
- 1045 S Main St Unit C3
- 1045 S Main St
- 1045 S Main St Unit C1
- 1045 S Main St Unit A6
- 1045 S Main St Unit A5
- 1045 S Main St Unit A4
- 1045 S Main St Unit A3
- 1045 S Main St Unit A2
- 1045 S Main St Unit A1
- 1045 S Main St
- 1045 S Main St
- 1045 S Main St