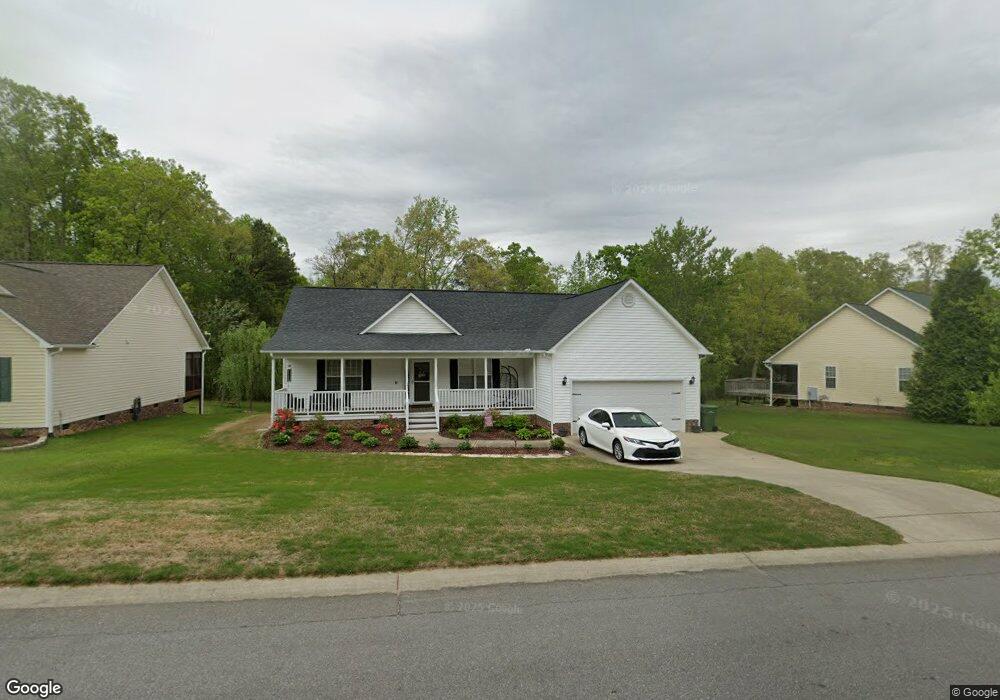
1045 S Willhaven Dr Fuquay Varina, NC 27526
Estimated Value: $363,000 - $387,801
3
Beds
2
Baths
1,596
Sq Ft
$236/Sq Ft
Est. Value
About This Home
This home is located at 1045 S Willhaven Dr, Fuquay Varina, NC 27526 and is currently estimated at $376,700, approximately $236 per square foot. 1045 S Willhaven Dr is a home located in Wake County with nearby schools including Achievement Charter Academy and Learning Time Academy.
Ownership History
Date
Name
Owned For
Owner Type
Purchase Details
Closed on
Jan 26, 2021
Sold by
Lowe John Richard and Lowe Amy J
Bought by
Goth Matthew E
Current Estimated Value
Home Financials for this Owner
Home Financials are based on the most recent Mortgage that was taken out on this home.
Original Mortgage
$256,500
Outstanding Balance
$229,292
Interest Rate
2.67%
Mortgage Type
New Conventional
Estimated Equity
$147,408
Purchase Details
Closed on
Aug 5, 2008
Sold by
Bls Inc
Bought by
Lowe Ii John Richard and Zaborowski Amy J
Home Financials for this Owner
Home Financials are based on the most recent Mortgage that was taken out on this home.
Original Mortgage
$139,920
Interest Rate
6.32%
Mortgage Type
Purchase Money Mortgage
Purchase Details
Closed on
May 8, 2007
Sold by
Southpaw Development Inc
Bought by
Bls Inc
Home Financials for this Owner
Home Financials are based on the most recent Mortgage that was taken out on this home.
Original Mortgage
$1,042,650
Interest Rate
6.12%
Mortgage Type
Purchase Money Mortgage
Create a Home Valuation Report for This Property
The Home Valuation Report is an in-depth analysis detailing your home's value as well as a comparison with similar homes in the area
Home Values in the Area
Average Home Value in this Area
Purchase History
| Date | Buyer | Sale Price | Title Company |
|---|---|---|---|
| Goth Matthew E | $270,000 | None Available | |
| Lowe Ii John Richard | $175,000 | None Available | |
| Bls Inc | $355,500 | None Available |
Source: Public Records
Mortgage History
| Date | Status | Borrower | Loan Amount |
|---|---|---|---|
| Open | Goth Matthew E | $256,500 | |
| Previous Owner | Lowe Ii John Richard | $139,920 | |
| Previous Owner | Bls Inc | $1,042,650 |
Source: Public Records
Tax History Compared to Growth
Tax History
| Year | Tax Paid | Tax Assessment Tax Assessment Total Assessment is a certain percentage of the fair market value that is determined by local assessors to be the total taxable value of land and additions on the property. | Land | Improvement |
|---|---|---|---|---|
| 2025 | $3,487 | $396,165 | $90,000 | $306,165 |
| 2024 | $3,473 | $396,165 | $90,000 | $306,165 |
| 2023 | $2,706 | $241,509 | $50,000 | $191,509 |
| 2022 | $2,543 | $241,509 | $50,000 | $191,509 |
| 2021 | $2,423 | $241,509 | $50,000 | $191,509 |
| 2020 | $2,423 | $241,509 | $50,000 | $191,509 |
| 2019 | $2,132 | $183,119 | $45,000 | $138,119 |
| 2018 | $2,010 | $183,119 | $45,000 | $138,119 |
| 2017 | $1,938 | $183,119 | $45,000 | $138,119 |
| 2016 | $1,912 | $183,119 | $45,000 | $138,119 |
| 2015 | $1,775 | $175,625 | $44,000 | $131,625 |
| 2014 | -- | $175,625 | $44,000 | $131,625 |
Source: Public Records
Map
Nearby Homes
- 1024 S Philwood Ct
- 1012 S Willhaven Dr
- 432 Barn View Ct
- 1008 S Fieldhaven Dr
- 912 Field Ivy Dr
- 704 Valleywater St
- 733 Bluffcreek Dr
- 1128 Crystalwater Dr
- 1014 S Main St
- 233 Theys Mill Way
- 1612 S Main St
- 905 Lily Claire Ln
- 912 Lily Claire Ln
- 143 Rusty Hook Ln Unit Lot 23
- 1305 Addison Lake St
- 1400 Addison Lake St
- 70 Saintsbury Dr
- 56 Saintsbury Dr
- 108 Teaser Dr
- 1000 Lily Claire Ln
- 1041 S Willhaven Dr
- 1051 S Willhaven Dr
- 1037 S Willhaven Dr
- 1055 S Willhaven Dr
- 1044 S Willhaven Dr
- 1040 S Willhaven Dr
- 1048 S Willhaven Dr
- 1059 S Willhaven Dr
- 1036 S Willhaven Dr
- 1052 S Willhaven Dr
- 1033 S Willhaven Dr
- 1056 S Willhaven Dr
- 1032 S Willhaven Dr
- 1063 S Willhaven Dr
- 1060 S Willhaven Dr
- 424 Henwood Ct
- 428 Henwood Ct
- 432 Henwood Ct
- 1035 Philwood Ct
- 1031 S Philwood Ct