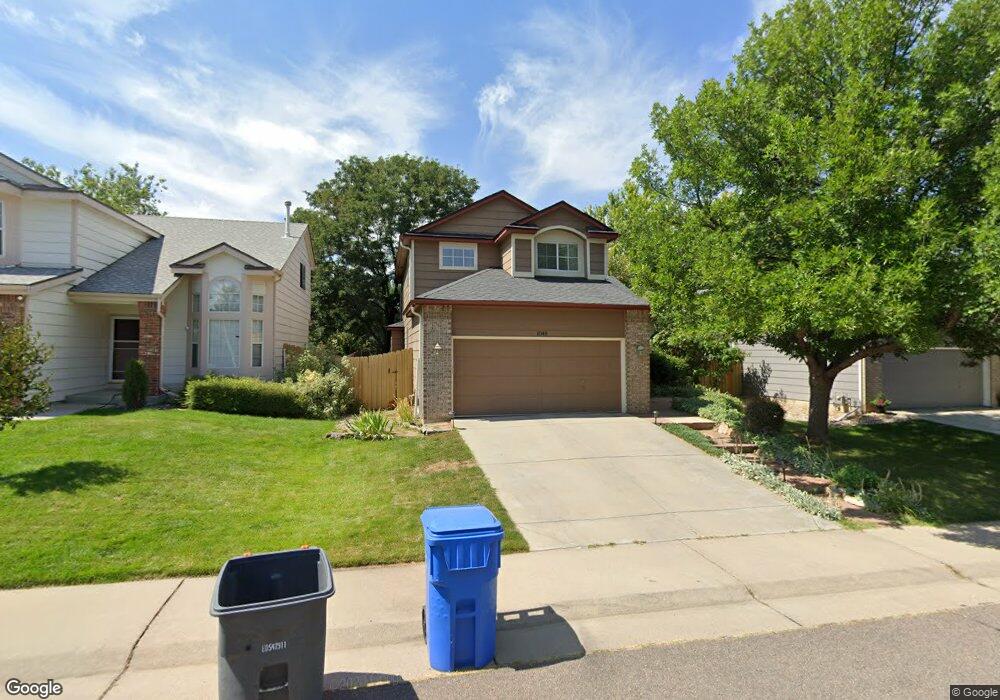
1045 Stoneham St Superior, CO 80027
Estimated Value: $724,597 - $843,000
4
Beds
3
Baths
1,958
Sq Ft
$395/Sq Ft
Est. Value
About This Home
This home is located at 1045 Stoneham St, Superior, CO 80027 and is currently estimated at $772,899, approximately $394 per square foot. 1045 Stoneham St is a home located in Boulder County with nearby schools including Eldorado K-8 School, Superior Elementary School, and Monarch High School.
Ownership History
Date
Name
Owned For
Owner Type
Purchase Details
Closed on
Sep 29, 2006
Sold by
Nicolay Marc and Nicolay Corie
Bought by
Carr O Colby
Current Estimated Value
Home Financials for this Owner
Home Financials are based on the most recent Mortgage that was taken out on this home.
Original Mortgage
$264,000
Outstanding Balance
$157,969
Interest Rate
6.51%
Mortgage Type
Purchase Money Mortgage
Estimated Equity
$614,930
Purchase Details
Closed on
Jul 1, 2002
Sold by
Wingert Jeffrey J and Wingert Emily M
Bought by
Nicolay Marc
Home Financials for this Owner
Home Financials are based on the most recent Mortgage that was taken out on this home.
Original Mortgage
$235,900
Interest Rate
6.78%
Purchase Details
Closed on
Feb 18, 1994
Sold by
Richmond Homes Inc Ii
Bought by
Wingert Jeffrey J
Home Financials for this Owner
Home Financials are based on the most recent Mortgage that was taken out on this home.
Original Mortgage
$146,400
Interest Rate
7.25%
Purchase Details
Closed on
Aug 24, 1993
Bought by
Carr O Colby
Purchase Details
Closed on
Dec 7, 1992
Bought by
Carr O Colby
Create a Home Valuation Report for This Property
The Home Valuation Report is an in-depth analysis detailing your home's value as well as a comparison with similar homes in the area
Home Values in the Area
Average Home Value in this Area
Purchase History
| Date | Buyer | Sale Price | Title Company |
|---|---|---|---|
| Carr O Colby | $330,000 | Land Title | |
| Nicolay Marc | $294,900 | -- | |
| Wingert Jeffrey J | $162,680 | Land Title | |
| Carr O Colby | -- | -- | |
| Carr O Colby | -- | -- |
Source: Public Records
Mortgage History
| Date | Status | Borrower | Loan Amount |
|---|---|---|---|
| Open | Carr O Colby | $264,000 | |
| Previous Owner | Nicolay Marc | $235,900 | |
| Previous Owner | Wingert Jeffrey J | $146,400 |
Source: Public Records
Tax History
| Year | Tax Paid | Tax Assessment Tax Assessment Total Assessment is a certain percentage of the fair market value that is determined by local assessors to be the total taxable value of land and additions on the property. | Land | Improvement |
|---|---|---|---|---|
| 2025 | $4,670 | $45,450 | $18,644 | $26,806 |
| 2024 | $4,670 | $45,450 | $18,644 | $26,806 |
| 2023 | $4,606 | $45,071 | $16,482 | $32,274 |
| 2022 | $3,410 | $32,602 | $12,197 | $20,405 |
| 2021 | $3,893 | $38,553 | $14,422 | $24,131 |
| 2020 | $3,700 | $35,214 | $12,870 | $22,344 |
| 2019 | $3,648 | $35,214 | $12,870 | $22,344 |
| 2018 | $3,391 | $32,422 | $10,080 | $22,342 |
| 2017 | $3,466 | $35,844 | $11,144 | $24,700 |
| 2016 | $3,338 | $30,169 | $10,428 | $19,741 |
| 2015 | $3,173 | $26,045 | $9,552 | $16,493 |
| 2014 | $2,765 | $26,045 | $9,552 | $16,493 |
Source: Public Records
Map
Nearby Homes
- 1340 Stoneham St
- 1220 S Boyero Ct
- 988 Promenade Dr
- 2321 Superior Dr
- 2331 Superior Dr
- 2351 Superior Dr
- 855 Superior Dr
- 2528 Emiline Way
- 2571 Emiline Way
- 2538 Emiline Way
- 2581 Emiline Way
- 2340 Discovery Pkwy
- 2585 Emiline Way
- 830 Josephine Way
- 730 Promenade Dr
- Marlee Plan at Downtown Superior - Heights
- Overland Plan at Downtown Superior - Heights
- Rosedale Plan at Downtown Superior - Heights
- Skyland Plan at Downtown Superior - Heights
- Wellshire Plan at Downtown Superior - Heights
- 1055 Stoneham St
- 1035 Stoneham St
- 1065 Stoneham St
- 1025 Stoneham St
- 1085 Stoneham St
- 1040 Stoneham St
- 1015 Stoneham St
- 1050 Stoneham St
- 1060 Stoneham St
- 1105 Stoneham St
- 1350 Stoneham St
- 1224 Snyder Way
- 1005 Stoneham St
- 1234 Snyder Way
- 1100 Stoneham St
- 1125 Stoneham St
- 1249 Snyder Way
- 1335 Stoneham St
- 1047 Raymer Ln
- 1067 Raymer Ln
Your Personal Tour Guide
Ask me questions while you tour the home.