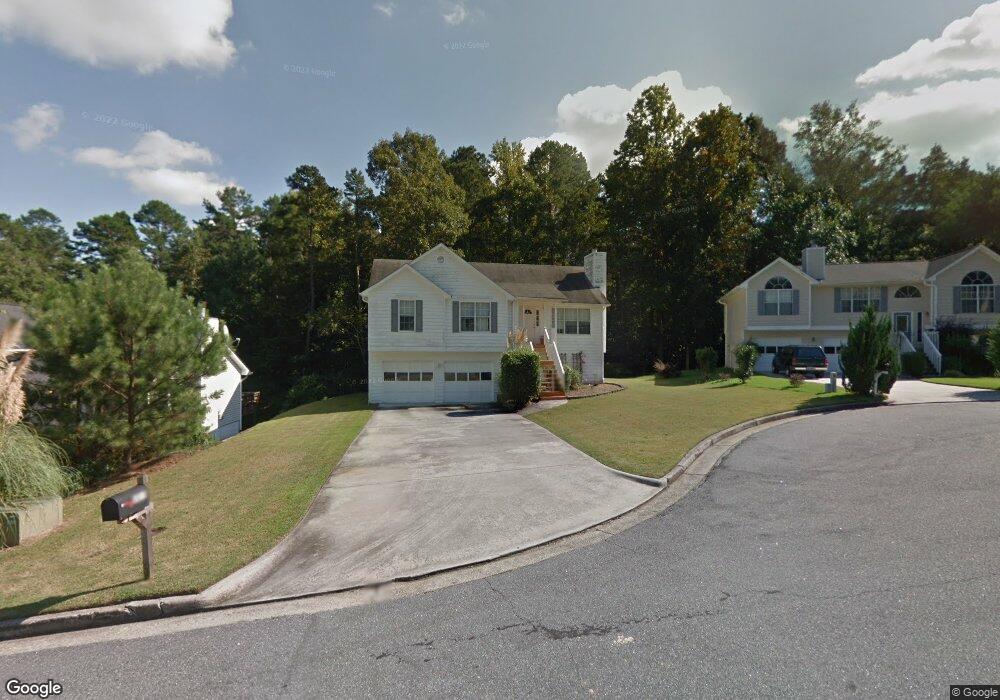
1045 Sycamore Summit Unit 6 Sugar Hill, GA 30518
Estimated Value: $330,000 - $378,000
3
Beds
3
Baths
1,291
Sq Ft
$274/Sq Ft
Est. Value
About This Home
This home is located at 1045 Sycamore Summit Unit 6, Sugar Hill, GA 30518 and is currently estimated at $353,185, approximately $273 per square foot. 1045 Sycamore Summit Unit 6 is a home located in Gwinnett County with nearby schools including Sycamore Elementary School, Lanier Middle School, and Lanier High School.
Ownership History
Date
Name
Owned For
Owner Type
Purchase Details
Closed on
May 9, 2013
Sold by
Panjwani Nooruddin S
Bought by
Panjwani Nooruddin S and Panjwani Laila N
Current Estimated Value
Home Financials for this Owner
Home Financials are based on the most recent Mortgage that was taken out on this home.
Original Mortgage
$105,569
Outstanding Balance
$74,159
Interest Rate
3.44%
Mortgage Type
New Conventional
Estimated Equity
$279,026
Purchase Details
Closed on
Apr 2, 2004
Sold by
Hud
Bought by
Panjwani Nooruddin S
Purchase Details
Closed on
Aug 5, 2003
Sold by
Homebanc Mtg Corp
Bought by
Sec Of Hud
Purchase Details
Closed on
Jul 23, 1999
Sold by
Burgamy Gena L
Bought by
Miller John H and Miller Nicola A
Home Financials for this Owner
Home Financials are based on the most recent Mortgage that was taken out on this home.
Original Mortgage
$129,250
Interest Rate
7.66%
Mortgage Type
FHA
Purchase Details
Closed on
Jul 17, 1995
Sold by
D Tel Inc
Bought by
Burgamy Gena L
Create a Home Valuation Report for This Property
The Home Valuation Report is an in-depth analysis detailing your home's value as well as a comparison with similar homes in the area
Home Values in the Area
Average Home Value in this Area
Purchase History
| Date | Buyer | Sale Price | Title Company |
|---|---|---|---|
| Panjwani Nooruddin S | -- | -- | |
| Panjwani Nooruddin S | -- | -- | |
| Sec Of Hud | -- | -- | |
| Homebanc Mtg Corp | $141,753 | -- | |
| Miller John H | $130,000 | -- | |
| Burgamy Gena L | $102,000 | -- |
Source: Public Records
Mortgage History
| Date | Status | Borrower | Loan Amount |
|---|---|---|---|
| Open | Panjwani Nooruddin S | $105,569 | |
| Previous Owner | Miller John H | $129,250 | |
| Closed | Burgamy Gena L | $0 |
Source: Public Records
Tax History Compared to Growth
Tax History
| Year | Tax Paid | Tax Assessment Tax Assessment Total Assessment is a certain percentage of the fair market value that is determined by local assessors to be the total taxable value of land and additions on the property. | Land | Improvement |
|---|---|---|---|---|
| 2025 | $428 | $112,000 | $28,800 | $83,200 |
| 2024 | $3,980 | $134,160 | $28,800 | $105,360 |
| 2023 | $3,980 | $122,080 | $26,000 | $96,080 |
| 2022 | $4,040 | $115,440 | $22,000 | $93,440 |
| 2021 | $2,966 | $83,080 | $14,400 | $68,680 |
| 2020 | $3,338 | $83,080 | $14,400 | $68,680 |
| 2019 | $2,933 | $75,520 | $14,400 | $61,120 |
| 2018 | $2,636 | $67,520 | $12,000 | $55,520 |
| 2016 | $1,713 | $43,600 | $8,000 | $35,600 |
| 2015 | $1,595 | $40,052 | $6,800 | $33,252 |
| 2014 | -- | $47,120 | $8,000 | $39,120 |
Source: Public Records
Map
Nearby Homes
- 1114 Danube Trail
- 1150 Sycamore Creek Trail
- 1025 Hunters Oak Trail
- 5660 Winter Bluff Way
- 978 Sugar Vista Cir
- 1541 Autumn Wood Trail
- 5650 Princeton Oaks Dr
- 965 Sugar Meadow Dr
- 5689 Winter Bluff Way
- 1230 Primrose Park Rd
- 5680 Princeton Oaks Dr
- 5605 Austin Garner Rd
- 5757 Riverside Dr Unit 2
- 1438 Autumn Wood Trail
- 5557 Pinedale Cir
- 965 Garner Spring Ln
- 1181 Chastain Dr
- 1055 Sycamore Summit
- 1035 Sycamore Summit Unit 6
- 1065 Sycamore Summit Unit 6
- 1025 Sycamore Summit
- 5602 Ardmore Ct Unit 6
- 5602 Ardmore Ct
- 1020 Sycamore Summit
- 1030 Sycamore Summit
- 1030 Sycamore Summit
- 1030 Sycamore Summit Unit 6
- 1075 Sycamore Summit Unit 6
- 1040 Sycamore Summit Unit 6
- 1085 Sycamore Summit
- 5612 Ardmore Ct
- 0 Ardmore Ct Unit 8663915
- 0 Ardmore Ct Unit 8409789
- 0 Ardmore Ct
- 0 Fishback Way Unit 7088053
- 0 Fishback Way
- 1106 Fishback Way