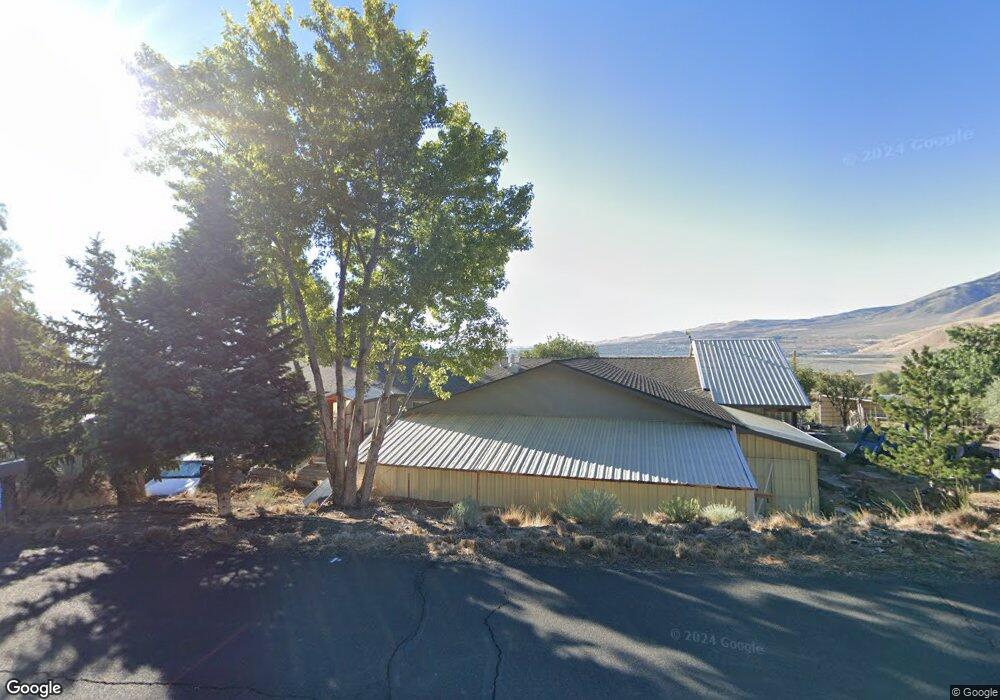
10450 Fort Churchill Rd Reno, NV 89508
Stead NeighborhoodEstimated Value: $558,319 - $613,000
4
Beds
2
Baths
1,798
Sq Ft
$323/Sq Ft
Est. Value
About This Home
This home is located at 10450 Fort Churchill Rd, Reno, NV 89508 and is currently estimated at $580,330, approximately $322 per square foot. 10450 Fort Churchill Rd is a home located in Washoe County with nearby schools including Desert Heights Elementary School, Cold Springs Middle Schools, and North Valleys High School.
Ownership History
Date
Name
Owned For
Owner Type
Purchase Details
Closed on
Feb 24, 2025
Sold by
Drakulich Joseph D and Drakulich Antoinette
Bought by
Joseph & Antoinette Drakulich 2025 Revocable and Drakulich
Current Estimated Value
Purchase Details
Closed on
Dec 15, 2014
Sold by
Drakulich Joseph D and Drakulich Antoinette
Bought by
Drakulich Joseph D and Drakulich Antoinette
Purchase Details
Closed on
Jun 20, 1994
Sold by
Streeper Melissa M
Bought by
Drakulich Joseph Dana and Drakulich Antoinette
Home Financials for this Owner
Home Financials are based on the most recent Mortgage that was taken out on this home.
Original Mortgage
$130,625
Interest Rate
8.83%
Purchase Details
Closed on
Mar 10, 1994
Sold by
Streeper Steven M
Bought by
Streeper Melissa M
Create a Home Valuation Report for This Property
The Home Valuation Report is an in-depth analysis detailing your home's value as well as a comparison with similar homes in the area
Home Values in the Area
Average Home Value in this Area
Purchase History
| Date | Buyer | Sale Price | Title Company |
|---|---|---|---|
| Joseph & Antoinette Drakulich 2025 Revocable | -- | None Listed On Document | |
| Drakulich Joseph D | -- | Capital Title Co | |
| Drakulich Joseph Dana | $137,500 | Western Title Company Inc | |
| Streeper Melissa M | -- | -- |
Source: Public Records
Mortgage History
| Date | Status | Borrower | Loan Amount |
|---|---|---|---|
| Previous Owner | Drakulich Joseph Dana | $130,625 |
Source: Public Records
Tax History Compared to Growth
Tax History
| Year | Tax Paid | Tax Assessment Tax Assessment Total Assessment is a certain percentage of the fair market value that is determined by local assessors to be the total taxable value of land and additions on the property. | Land | Improvement |
|---|---|---|---|---|
| 2025 | $2,107 | $87,805 | $42,000 | $45,805 |
| 2024 | $2,107 | $89,372 | $42,000 | $47,373 |
| 2023 | $2,046 | $87,596 | $42,000 | $45,596 |
| 2022 | $1,986 | $71,819 | $33,250 | $38,569 |
| 2021 | $1,929 | $61,213 | $22,400 | $38,813 |
| 2020 | $1,871 | $62,159 | $22,400 | $39,759 |
| 2019 | $1,816 | $61,527 | $22,820 | $38,707 |
| 2018 | $1,763 | $55,134 | $16,660 | $38,474 |
| 2017 | $1,712 | $54,976 | $15,750 | $39,226 |
| 2016 | $1,669 | $54,714 | $14,315 | $40,399 |
| 2015 | $1,665 | $53,297 | $12,355 | $40,942 |
| 2014 | $1,593 | $50,315 | $10,955 | $39,360 |
| 2013 | -- | $47,736 | $8,470 | $39,266 |
Source: Public Records
Map
Nearby Homes
- 10300 Sutters Mill Ln
- 10705 Silver Spur Dr
- 10725 Santa fe Rd
- 00 Plata Mesa Dr
- 8350 Osage Rd
- 11150 Carlsbad Rd
- 10605 Osage Rd
- 0 N Red Rock Rd Unit 250000494
- 10035 Osage Rd
- 9500 N Red Rock Rd
- 10150 Coyote Run Ct
- 8275 Shifting Sands Dr Unit 21
- 7663 Crystal Shores Dr
- 8720 Malibu Dr
- 7956 White Falls Dr
- 7973 Moss Creek Dr
- 8451 Seal Beach Dr
- Red Rock 19.82 Acres
- 8430 Seal Beach Dr
- 8529 Red Baron Blvd
- 10400 Fort Churchill Rd
- 10505 Fort Churchill Rd
- 10300 Bighorn Dr
- 10305 Bighorn Dr
- 10455 Fort Churchill Rd
- 10455 Fort Churchill Rd
- 10455 Fort Churchill Rd
- 10400 Bighorn Dr
- 10300 Fort Churchill Rd
- 10455 Bighorn Dr
- 10450 Bighorn Dr
- 10440 San Fernando Rd
- 10280 Fort Churchill Rd
- 10295 Bighorn Dr
- 10430 San Fernando Rd
- 10525 Red Rock Rd
- 10480 San Fernando Rd
- 10475 N Red Rock Rd
- 10475 Red Rock Rd
- 10420 San Fernando Rd