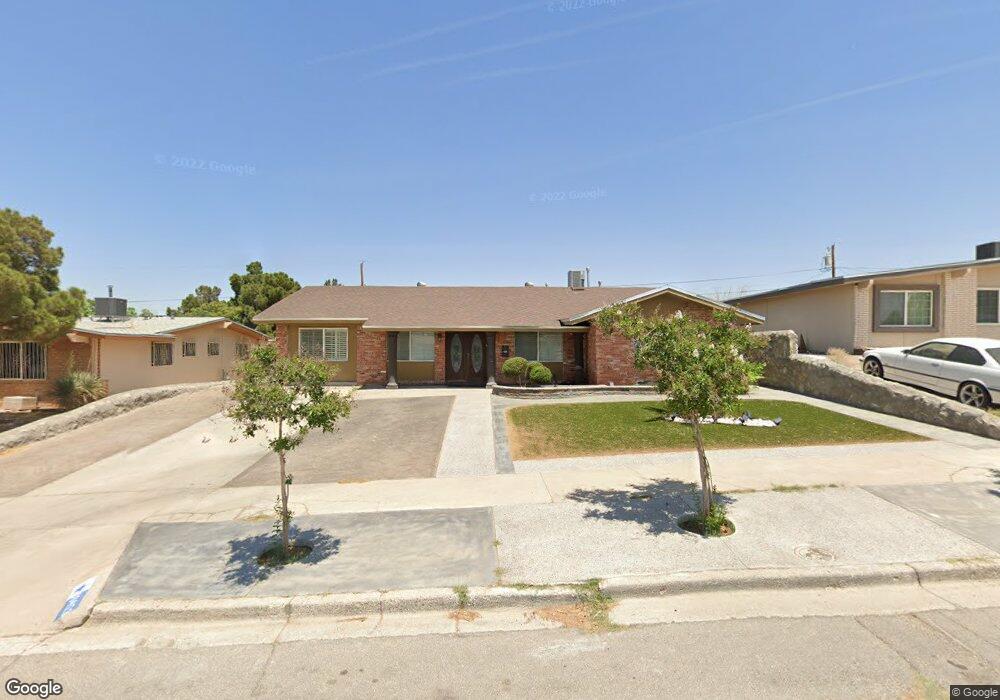
10453 Chinaberry Dr El Paso, TX 79925
Travis White NeighborhoodEstimated Value: $212,000 - $225,000
4
Beds
2
Baths
1,336
Sq Ft
$162/Sq Ft
Est. Value
About This Home
This home is located at 10453 Chinaberry Dr, El Paso, TX 79925 and is currently estimated at $216,463, approximately $162 per square foot. 10453 Chinaberry Dr is a home located in El Paso County with nearby schools including Eastwood Heights Elementary School, Eastwood High School, and St. Raphael School.
Ownership History
Date
Name
Owned For
Owner Type
Purchase Details
Closed on
Jun 14, 2010
Sold by
Trien John H
Bought by
Degutierrez Maria D Amaya
Current Estimated Value
Home Financials for this Owner
Home Financials are based on the most recent Mortgage that was taken out on this home.
Original Mortgage
$105,000
Interest Rate
12%
Mortgage Type
Seller Take Back
Purchase Details
Closed on
Apr 23, 2009
Sold by
Armendariz Cruz
Bought by
Trien John H
Purchase Details
Closed on
Nov 6, 2006
Sold by
Veliz Robert
Bought by
Meraz Roberto and Meraz Hortencia
Home Financials for this Owner
Home Financials are based on the most recent Mortgage that was taken out on this home.
Original Mortgage
$100,000
Interest Rate
6.37%
Mortgage Type
Seller Take Back
Purchase Details
Closed on
Apr 18, 2005
Sold by
Duckworth Elizabeth
Bought by
Will Dylan Investments Inc
Create a Home Valuation Report for This Property
The Home Valuation Report is an in-depth analysis detailing your home's value as well as a comparison with similar homes in the area
Home Values in the Area
Average Home Value in this Area
Purchase History
| Date | Buyer | Sale Price | Title Company |
|---|---|---|---|
| Degutierrez Maria D Amaya | -- | None Available | |
| Trien John H | -- | None Available | |
| Meraz Roberto | -- | None Available | |
| Will Dylan Investments Inc | $36,000 | -- |
Source: Public Records
Mortgage History
| Date | Status | Borrower | Loan Amount |
|---|---|---|---|
| Closed | Degutierrez Maria D Amaya | $105,000 | |
| Previous Owner | Meraz Roberto | $100,000 |
Source: Public Records
Tax History Compared to Growth
Tax History
| Year | Tax Paid | Tax Assessment Tax Assessment Total Assessment is a certain percentage of the fair market value that is determined by local assessors to be the total taxable value of land and additions on the property. | Land | Improvement |
|---|---|---|---|---|
| 2025 | $2,788 | $181,640 | -- | -- |
| 2024 | $2,788 | $165,127 | -- | -- |
| 2023 | $2,557 | $150,115 | $0 | $0 |
| 2022 | $4,238 | $136,468 | $0 | $0 |
| 2021 | $4,033 | $124,062 | $20,762 | $103,300 |
| 2020 | $3,573 | $113,133 | $15,971 | $97,162 |
| 2018 | $3,489 | $113,275 | $15,971 | $97,304 |
| 2017 | $3,118 | $102,000 | $15,971 | $86,029 |
| 2016 | $3,118 | $102,000 | $15,971 | $86,029 |
| 2015 | $2,379 | $102,000 | $15,971 | $86,029 |
| 2014 | $2,379 | $102,000 | $15,971 | $86,029 |
Source: Public Records
Map
Nearby Homes
- 10412 Chinaberry Dr
- 10401 Springwood Dr
- 10481 Deepwood Ct
- 10212 Garwood Ct
- 10463 Davwood Ln
- 7936 Dogwood St
- 7921 Candlewood Ave
- 10533 Springwood Dr
- 1207 Bois d Arc Dr
- 9801 Eastridge Dr
- 10617 Candlewood Ave
- 10233 Byway Dr
- 10313 Byway Dr
- 1909 Crow Dr
- 10304 Woodruff Ct
- 1955 Trawood Dr Unit 12
- 10145 Camwood Dr
- 10309 Woodruff Ct
- 9525 Desert Ridge Dr
- 7761 Maverick Ave
- 10457 Chinaberry Dr
- 10449 Chinaberry Dr
- 10438 Tomwood Ave
- 10440 Tomwood Ave
- 10436 Tomwood Ave
- 10461 Chinaberry Dr
- 10445 Chinaberry Dr
- 10442 Tomwood Ave
- 10452 Chinaberry Dr
- 10434 Tomwood Ave
- 10456 Chinaberry Dr
- 10448 Chinaberry Dr
- 10441 Chinaberry Dr
- 10465 Chinaberry Dr
- 10460 Chinaberry Dr
- 10444 Tomwood Ave
- 10432 Tomwood Ave
- 10437 Chinaberry Dr
- 10464 Chinaberry Dr
- 10440 Chinaberry Dr