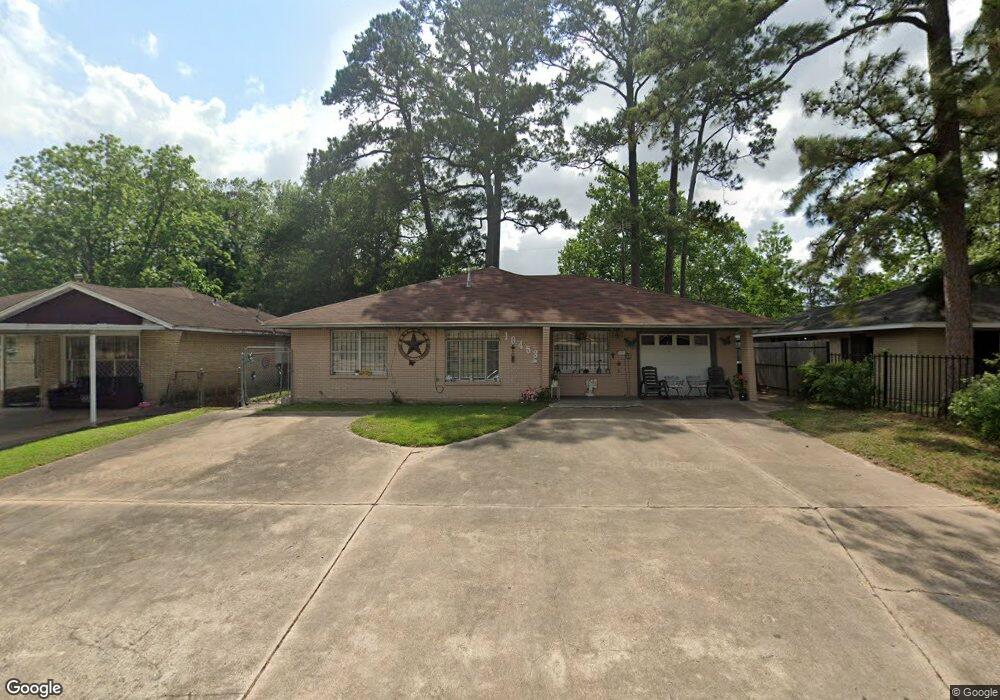
10453 Wolbrook St Houston, TX 77016
East Little York NeighborhoodEstimated Value: $188,000 - $229,000
4
Beds
3
Baths
1,654
Sq Ft
$126/Sq Ft
Est. Value
About This Home
This home is located at 10453 Wolbrook St, Houston, TX 77016 and is currently estimated at $208,897, approximately $126 per square foot. 10453 Wolbrook St is a home located in Harris County with nearby schools including Shadydale Elementary School, Forest Brook Middle, and North Forest High School.
Ownership History
Date
Name
Owned For
Owner Type
Purchase Details
Closed on
Dec 10, 2019
Sold by
Davila Bernardo
Bought by
Davila Myran
Current Estimated Value
Purchase Details
Closed on
Apr 29, 2011
Sold by
Fannie Mae
Bought by
Davila Bernardo
Purchase Details
Closed on
Feb 2, 2010
Sold by
Abdelrahman Deloris F
Bought by
Federal National Mortgage Association
Purchase Details
Closed on
Aug 9, 2006
Sold by
Ali Ahmad H
Bought by
Abdelrahman Deloris
Home Financials for this Owner
Home Financials are based on the most recent Mortgage that was taken out on this home.
Original Mortgage
$76,500
Interest Rate
6.78%
Mortgage Type
Purchase Money Mortgage
Purchase Details
Closed on
Oct 22, 2002
Sold by
Holman James
Bought by
Ali Ahmad H
Purchase Details
Closed on
May 4, 1996
Sold by
Walker Pamela Faye and Lee Edna Faye
Bought by
Holmon Rosetta C
Create a Home Valuation Report for This Property
The Home Valuation Report is an in-depth analysis detailing your home's value as well as a comparison with similar homes in the area
Home Values in the Area
Average Home Value in this Area
Purchase History
| Date | Buyer | Sale Price | Title Company |
|---|---|---|---|
| Davila Myran | -- | None Available | |
| Davila Bernardo | -- | Texas American Title Company | |
| Federal National Mortgage Association | $62,836 | None Available | |
| Abdelrahman Deloris | -- | Greater Texas Title Company | |
| Ali Ahmad H | -- | Stewart Title Company | |
| Holmon Rosetta C | -- | -- |
Source: Public Records
Mortgage History
| Date | Status | Borrower | Loan Amount |
|---|---|---|---|
| Previous Owner | Abdelrahman Deloris | $76,500 |
Source: Public Records
Tax History Compared to Growth
Tax History
| Year | Tax Paid | Tax Assessment Tax Assessment Total Assessment is a certain percentage of the fair market value that is determined by local assessors to be the total taxable value of land and additions on the property. | Land | Improvement |
|---|---|---|---|---|
| 2025 | $3,962 | $189,350 | $60,180 | $129,170 |
| 2024 | $3,962 | $189,350 | $60,180 | $129,170 |
| 2023 | $3,962 | $196,003 | $37,170 | $158,833 |
| 2022 | $3,530 | $160,302 | $24,780 | $135,522 |
| 2021 | $3,375 | $144,800 | $24,780 | $120,020 |
| 2020 | $3,149 | $130,028 | $19,116 | $110,912 |
| 2019 | $3,399 | $134,330 | $12,744 | $121,586 |
| 2018 | $2,259 | $89,254 | $12,744 | $76,510 |
| 2017 | $2,257 | $89,254 | $12,744 | $76,510 |
| 2016 | $2,114 | $83,586 | $12,744 | $70,842 |
| 2015 | $1,323 | $51,456 | $12,744 | $38,712 |
| 2014 | $1,323 | $51,456 | $12,744 | $38,712 |
Source: Public Records
Map
Nearby Homes
- 10434 Envoy St
- 10535 Hollyglen Dr
- 10526 Hollyglen Dr
- 5905 Langley Rd
- 10430 Royal Oaks Dr
- 10538 Royal Oaks Dr
- 10221 Bretton Dr
- 5618 Briarwick Ln
- 10606 Bucknell Rd
- 10627 Castleton St
- 6001 Bretshire Dr
- 10317 Kelburn Dr
- 10201 Homestead Rd
- 10122 Rockaway Dr
- 5611 Yorkwood St
- 7210 Colton St
- 5123 Francine Ln
- 10806 Bird of Paradise Ln
- 10808 Bird of Paradise Ln
- 10810 Bird of Paradise Ln
- 10449 Wolbrook St
- 10457 Wolbrook St
- 10445 Wolbrook St
- 10454 Castleton St
- 10458 Castleton St
- 10450 Castleton St
- 10446 Castleton St
- 10441 Wolbrook St
- 10454 Wolbrook St
- 10450 Wolbrook St
- 10458 Wolbrook St
- 10501 Wolbrook St
- 10442 Castleton St
- 10446 Wolbrook St
- 10502 Castleton St
- 10437 Wolbrook St
- 10442 Wolbrook St
- 10505 Wolbrook St
- 10502 Wolbrook St
- 10438 Castleton St