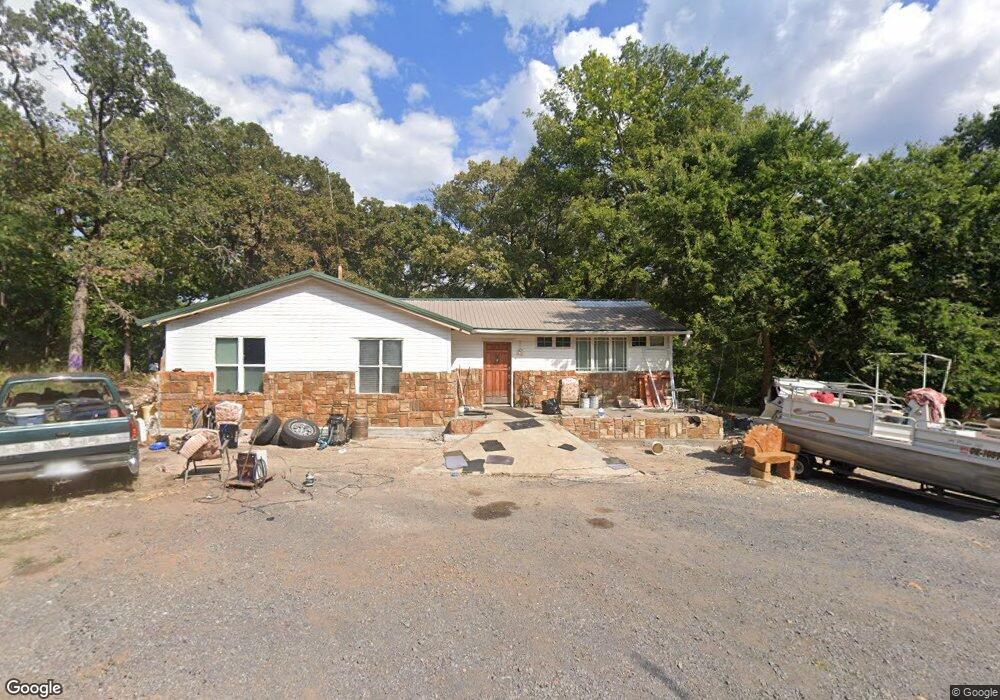
10456 N 60th St E Wagoner, OK 74467
Estimated Value: $93,353 - $190,000
3
Beds
1
Bath
1,200
Sq Ft
$127/Sq Ft
Est. Value
About This Home
This home is located at 10456 N 60th St E, Wagoner, OK 74467 and is currently estimated at $152,588, approximately $127 per square foot. 10456 N 60th St E is a home located in Wagoner County with nearby schools including Okay Elementary School and Okay High School.
Ownership History
Date
Name
Owned For
Owner Type
Purchase Details
Closed on
Oct 12, 2023
Sold by
Swenson Rita
Bought by
Swenson Rita and Swenson Swen
Current Estimated Value
Purchase Details
Closed on
Jan 23, 2020
Sold by
Mcfarlin Gina and Mcfarlin David
Bought by
End Whittney
Purchase Details
Closed on
Oct 15, 2019
Sold by
Mcmurtray Travis and Mcmurtray Erin
Bought by
Mcfarlin Gina Marie
Purchase Details
Closed on
Dec 29, 2017
Sold by
Burriss Debra L
Bought by
Mcmurtray Travis Lee
Purchase Details
Closed on
Oct 14, 2011
Sold by
Burriss Robert C and Burriss Debra L
Bought by
Burriss Debra L
Purchase Details
Closed on
Feb 21, 2007
Sold by
Hall Tiffany Danielle and Hall Gary Wayne
Bought by
Burriss Robert C and Burriss Debra L
Purchase Details
Closed on
Nov 5, 2002
Sold by
Paige Garlene
Purchase Details
Closed on
Sep 6, 2001
Sold by
Hulen William Clay
Purchase Details
Closed on
Aug 17, 2001
Sold by
Paige Garlene
Create a Home Valuation Report for This Property
The Home Valuation Report is an in-depth analysis detailing your home's value as well as a comparison with similar homes in the area
Home Values in the Area
Average Home Value in this Area
Purchase History
| Date | Buyer | Sale Price | Title Company |
|---|---|---|---|
| Swenson Rita | -- | None Listed On Document | |
| End Whittney | -- | None Available | |
| Mcfarlin Gina Marie | -- | None Available | |
| Mcmurtray Travis Lee | -- | -- | |
| Burriss Debra L | -- | -- | |
| Burriss Robert C | -- | None Available | |
| -- | -- | -- | |
| -- | -- | -- | |
| -- | -- | -- |
Source: Public Records
Tax History Compared to Growth
Tax History
| Year | Tax Paid | Tax Assessment Tax Assessment Total Assessment is a certain percentage of the fair market value that is determined by local assessors to be the total taxable value of land and additions on the property. | Land | Improvement |
|---|---|---|---|---|
| 2024 | $324 | $4,320 | $149 | $4,171 |
| 2023 | $309 | $4,115 | $149 | $3,966 |
| 2022 | $297 | $3,919 | $149 | $3,770 |
| 2021 | $206 | $2,699 | $105 | $2,594 |
| 2020 | $172 | $2,196 | $105 | $2,091 |
| 2019 | $176 | $2,166 | $105 | $2,061 |
| 2018 | $176 | $2,166 | $105 | $2,061 |
| 2017 | $375 | $4,650 | $105 | $4,545 |
| 2016 | $360 | $4,428 | $105 | $4,323 |
| 2015 | $343 | $4,218 | $105 | $4,113 |
| 2014 | $328 | $4,379 | $420 | $3,959 |
Source: Public Records
Map
Nearby Homes
- 5917 E 109th St N
- 5999 E 109th St N
- 11609 N 59th St E
- 3999 E 100th St N
- 5740 E 84th St N
- 6122 E 83rd St N
- 6106 E 82nd St N
- 1925 E 100th St N
- 20048 S Pistol Point Rd
- 4157 W Roadrunner Dr
- 12 E 90th St N
- 4332 W Roadrunner Dr
- 4289 W Timber Ridge Dr
- 20326 S Rocky Haven Dr
- 74983 S 320 Rd
- 74124 S Fir Rd
- 74123 Dogwood Rd
- 74091 S Fir Rd
- 20988 Ranger Rd
- 74036 S Fir Rd
- 10390 N 60th St E
- 10489 N 61st St E
- 69821 S 340 Ave
- 10473 N 60th St E
- 6115 E 104th St N
- 6066 E 103rd St N
- 6107 E 105th St N
- 6123 E 105th St N
- 6119 E 105th St N
- 10325 N 60th St E
- 5903 E 105th St N
- 6148 E 104th St N
- 234 Rr 2
- 6139 E 104th St N
- 10283 N 61st St E
- 10245 N 61st St E
- 10268 N 60th St E
- 10265 N 60th St E
- 10503 N 59th St E
- 27500 Ns 423 Rd