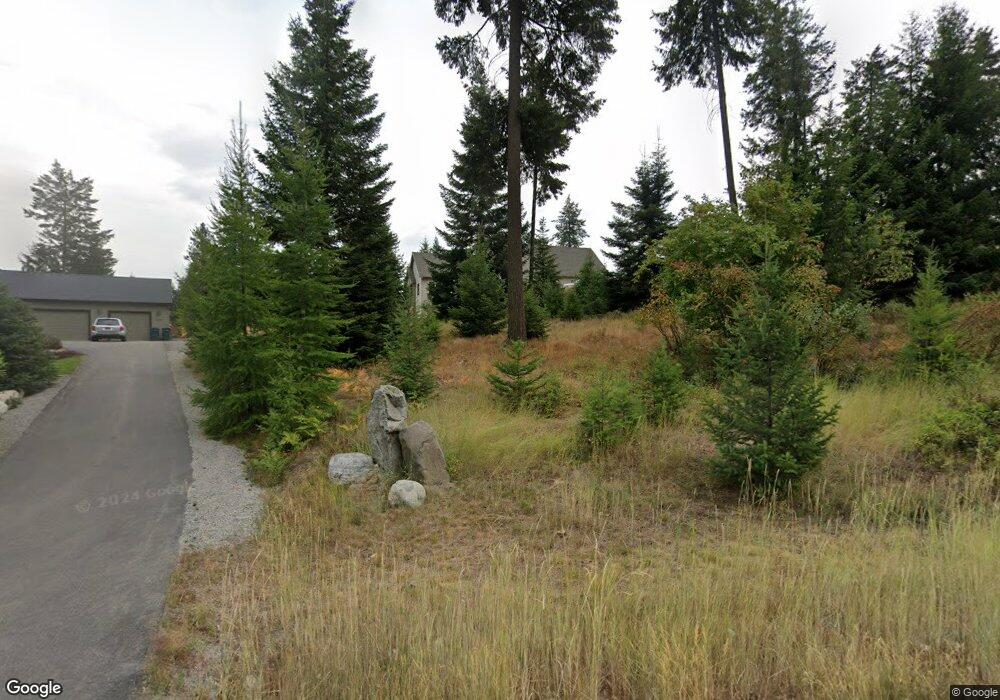
10459 N Summit Loop Hauser, ID 83854
Estimated Value: $864,000 - $936,000
3
Beds
2
Baths
2,785
Sq Ft
$320/Sq Ft
Est. Value
About This Home
This home is located at 10459 N Summit Loop, Hauser, ID 83854 and is currently estimated at $890,992, approximately $319 per square foot. 10459 N Summit Loop is a home with nearby schools including Betty Kiefer Elementary School, Lakeland Middle School, and Lakeland Senior High School.
Ownership History
Date
Name
Owned For
Owner Type
Purchase Details
Closed on
Feb 13, 2024
Sold by
Hansen Michael L and Hansen Shirley J
Bought by
Carroll Joseph R and Carroll Tanya L
Current Estimated Value
Purchase Details
Closed on
Oct 28, 2021
Sold by
Glaser James W
Bought by
Glaser James W and James W And Janice H Glaser Tr
Purchase Details
Closed on
Oct 19, 2005
Sold by
Garrett Design & Construction Inc
Bought by
Glaser James W and Glaser Janice H
Home Financials for this Owner
Home Financials are based on the most recent Mortgage that was taken out on this home.
Original Mortgage
$292,248
Interest Rate
5.68%
Mortgage Type
New Conventional
Purchase Details
Closed on
Mar 7, 2005
Sold by
Northem Development Llc
Bought by
Garrett Construction Inc
Create a Home Valuation Report for This Property
The Home Valuation Report is an in-depth analysis detailing your home's value as well as a comparison with similar homes in the area
Purchase History
| Date | Buyer | Sale Price | Title Company |
|---|---|---|---|
| Carroll Joseph R | -- | Titleone | |
| Glaser James W | -- | None Available | |
| James W And Janice H Glaser Trust | -- | None Listed On Document | |
| Glaser James W | -- | -- | |
| Garrett Construction Inc | -- | None Available |
Source: Public Records
Mortgage History
| Date | Status | Borrower | Loan Amount |
|---|---|---|---|
| Previous Owner | Glaser James W | $292,248 |
Source: Public Records
Tax History
| Year | Tax Paid | Tax Assessment Tax Assessment Total Assessment is a certain percentage of the fair market value that is determined by local assessors to be the total taxable value of land and additions on the property. | Land | Improvement |
|---|---|---|---|---|
| 2025 | $1,913 | $784,560 | $278,770 | $505,790 |
| 2024 | $2,239 | $770,210 | $263,770 | $506,440 |
| 2023 | $2,239 | $761,112 | $183,770 | $577,342 |
| 2022 | $2,817 | $842,600 | $203,572 | $639,028 |
| 2021 | $2,720 | $525,920 | $161,450 | $364,470 |
| 2020 | $2,836 | $458,668 | $136,088 | $322,580 |
| 2019 | $2,888 | $415,488 | $111,088 | $304,400 |
| 2018 | $2,934 | $380,498 | $101,088 | $279,410 |
| 2017 | $2,976 | $359,318 | $95,798 | $263,520 |
| 2016 | $2,564 | $331,157 | $80,797 | $250,360 |
| 2015 | $2,571 | $328,310 | $80,000 | $248,310 |
| 2013 | $2,328 | $281,442 | $55,942 | $225,500 |
Source: Public Records
Map
Nearby Homes
- 18059 N Advent Ln
- 9798 N Willowherb Ct
- 18321 W Rice Ave
- 11413 N Summit Loop
- 17953 W Sheltered Ct
- 17372 W Kathleen Ave
- 18493 W Holliday Way
- 18549 W Holliday Way
- 11776 N Hauser Lake Rd Unit SPC 6
- 10309 N Lookout View Ln
- NKA Hildesheim Ln
- 8057 N Vogt Rd
- 10176 N Cliff House Rd
- 17580 W Santiago Cir
- 8553 N Kendra Way
- 16939 W Santiago Cir
- NKA W Woodlake Dr
- NKA W Julia Dr
- 13846 N Hauser Lake Rd
- 10824 N Payment Peak Rd
- 10523 N Summit Loop
- 10415 N Summit Loop
- 10553 N Summit Loop
- 0 Nna Summit Loop
- 10119 N Log Pine Ct Unit Hauser Lake, Idaho
- 10563 N Summit Loop
- NKA N Summit Loop
- 0 N Summit Loop
- LT12 BLK 5 N Summit Loop
- Lt12,Blk5 N Summit Loop
- LT12 BLK5 N Summit Loop
- LT2BLK9 N Summit Loop
- LT13 BLK5 N Summit Loop
- 0 Lot 12 Block 5 Unit 15-12536
- 10149 N Log Pine Ct Unit Hauser
- 10149 N Log Pine Ct
- 10384 N Summit Loop
- 0 Summit Unit 11-2200
- 0 Summit Unit 8-7007
- 0 Summit Unit 8-5570
Your Personal Tour Guide
Ask me questions while you tour the home.