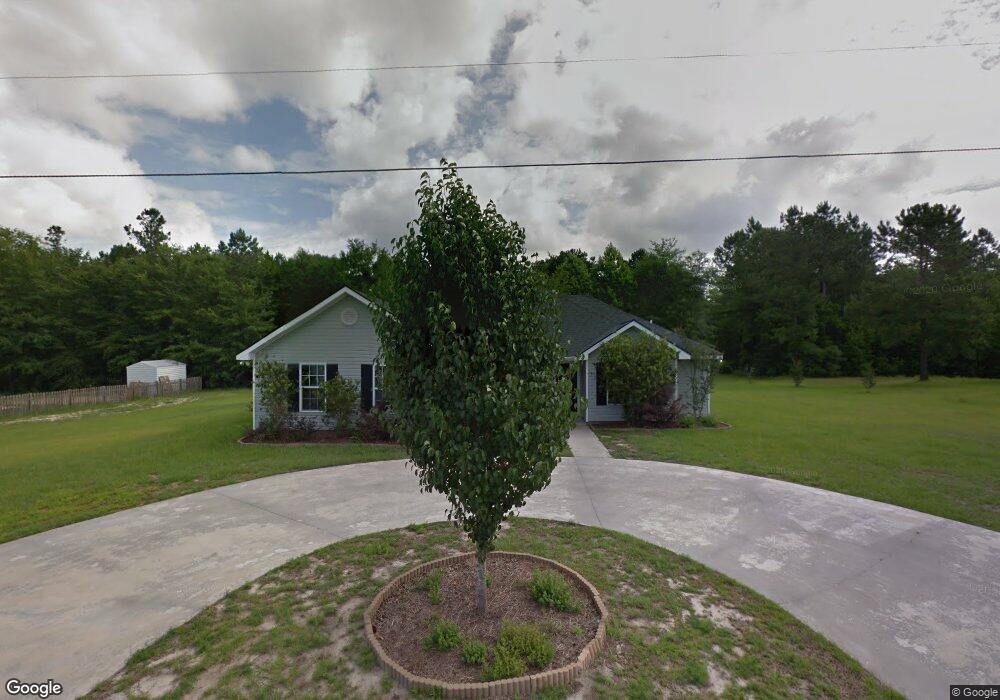
1046 Chart Ln SE Townsend, GA 31331
Estimated Value: $286,355 - $331,000
3
Beds
2
Baths
1,869
Sq Ft
$164/Sq Ft
Est. Value
About This Home
This home is located at 1046 Chart Ln SE, Townsend, GA 31331 and is currently estimated at $306,839, approximately $164 per square foot. 1046 Chart Ln SE is a home located in McIntosh County with nearby schools including Todd Grant Elementary School, McIntosh County Middle School, and McIntosh County Academy.
Ownership History
Date
Name
Owned For
Owner Type
Purchase Details
Closed on
Nov 2, 2021
Sold by
Hoyt William W
Bought by
Hoyt William W and Hoyt Katarina
Current Estimated Value
Home Financials for this Owner
Home Financials are based on the most recent Mortgage that was taken out on this home.
Original Mortgage
$90,000
Interest Rate
2.99%
Mortgage Type
New Conventional
Purchase Details
Closed on
Jan 11, 2013
Sold by
Mcgill Heather Lynn
Bought by
Hoyt William W
Home Financials for this Owner
Home Financials are based on the most recent Mortgage that was taken out on this home.
Original Mortgage
$97,959
Interest Rate
3.36%
Mortgage Type
New Conventional
Purchase Details
Closed on
Jul 28, 2006
Sold by
Colonial Coast Development Com
Bought by
Mcgill Patrick Ray
Home Financials for this Owner
Home Financials are based on the most recent Mortgage that was taken out on this home.
Original Mortgage
$136,995
Interest Rate
6.74%
Mortgage Type
New Conventional
Purchase Details
Closed on
Jul 27, 2006
Sold by
Colonial Coast Development
Bought by
Mcgill Patrick Ray and Mcgill Heather Lynn
Home Financials for this Owner
Home Financials are based on the most recent Mortgage that was taken out on this home.
Original Mortgage
$136,995
Interest Rate
6.74%
Mortgage Type
New Conventional
Purchase Details
Closed on
Apr 21, 2006
Sold by
Coastal Pines
Bought by
Colonial Coast Development Company
Create a Home Valuation Report for This Property
The Home Valuation Report is an in-depth analysis detailing your home's value as well as a comparison with similar homes in the area
Purchase History
| Date | Buyer | Sale Price | Title Company |
|---|---|---|---|
| Hoyt William W | -- | -- | |
| Hoyt William W | $95,000 | -- | |
| Hoyt William W | -- | -- | |
| Mcgill Patrick Ray | $137,000 | -- | |
| Mcgill Patrick Ray | $136,995 | -- | |
| Colonial Coast Development Company | $90,000 | -- |
Source: Public Records
Mortgage History
| Date | Status | Borrower | Loan Amount |
|---|---|---|---|
| Closed | Hoyt William W | $90,000 | |
| Previous Owner | Hoyt William W | $97,959 | |
| Previous Owner | Mcgill Patrick Ray | $136,995 | |
| Previous Owner | Mcgill Patrick Ray | $136,995 |
Source: Public Records
Tax History
| Year | Tax Paid | Tax Assessment Tax Assessment Total Assessment is a certain percentage of the fair market value that is determined by local assessors to be the total taxable value of land and additions on the property. | Land | Improvement |
|---|---|---|---|---|
| 2024 | $3,082 | $105,600 | $5,000 | $100,600 |
| 2023 | $2,988 | $101,840 | $5,000 | $96,840 |
| 2022 | $2,489 | $83,920 | $5,000 | $78,920 |
| 2021 | $1,665 | $62,640 | $5,000 | $57,640 |
| 2020 | $1,793 | $58,240 | $5,000 | $53,240 |
| 2019 | $1,773 | $61,000 | $5,000 | $56,000 |
| 2018 | $1,518 | $57,120 | $6,000 | $51,120 |
| 2017 | $1,371 | $45,800 | $6,000 | $39,800 |
| 2016 | $1,194 | $39,200 | $6,000 | $33,200 |
| 2015 | $1,164 | $38,884 | $4,000 | $34,884 |
| 2014 | $1,142 | $38,884 | $4,000 | $34,884 |
Source: Public Records
Map
Nearby Homes
- 1441 Halyard Way SE
- 1221 Nautical Dr SE
- 1215 Tidal Dr SE
- PRICE IMPROVEMENT Smith Rd SE
- 5096 Smith Rd
- 1247 Sapelo Cir SE
- 1563 Sapelo Cir SE
- 18 Doboy Ct
- 1264 Jones Way SE
- 1757 Mcintosh Trail SE
- 0 Highway 99 Unit 22514247
- 1474 Mcintosh Trail SE
- Lot 21 Sutherland Bluff Dr NE
- LOT A Ga Highway 99
- 5554 Ga Highway 99
- 0 Landing Rd SE Unit 1659735
- 0 Briar Patch Rd SE Unit 1658040
- 0 Briar Patch Rd SE Unit 1658033
- 0 Briar Patch Rd SE Unit 1658042
- 0 Briar Patch Rd SE Unit 1658032
- 1046 Chart Ln SE
- 1080 Chart Ln SE
- 1022 Chart Ln SE
- 51 Chart Ln
- 54 Chart Ln
- 53 Chart Ln
- 58 Chart Ln
- 57 Chart Ln
- 1033 Chart Ln SE
- 1104 Chart Ln SE
- 111 Chart Ln
- 1465 Halyard Way SE Unit 59
- 1465 Halyard Way SE
- 1015 Chart Ln SE
- 1164 Chart Ln SE
- 1182 Chart Ln SE
- 1182 Chart Ln SE
- 1107 Chart Ln SE
- 1235 McClow Ln SE
- 1115 Chart Ln SE
Your Personal Tour Guide
Ask me questions while you tour the home.