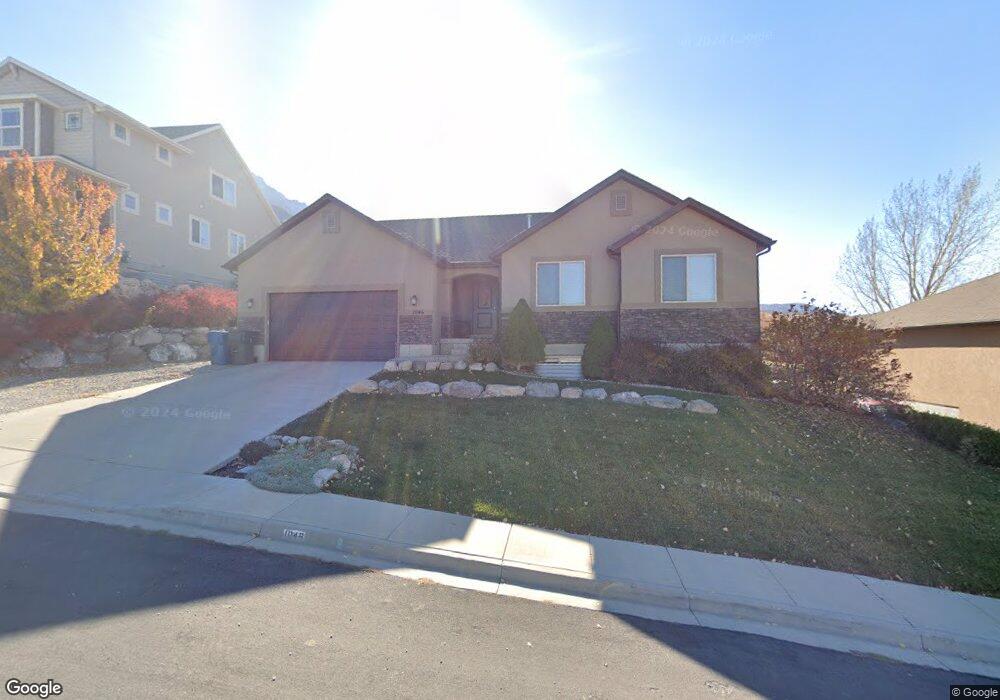
1046 E 430 S Unit 34 Santaquin, UT 84655
Estimated Value: $511,000 - $565,000
3
Beds
2
Baths
1,418
Sq Ft
$380/Sq Ft
Est. Value
About This Home
This home is located at 1046 E 430 S Unit 34, Santaquin, UT 84655 and is currently estimated at $538,262, approximately $379 per square foot. 1046 E 430 S Unit 34 is a home located in Utah County with nearby schools including Orchard Hills Elementary School, Payson Junior High School, and Payson High School.
Ownership History
Date
Name
Owned For
Owner Type
Purchase Details
Closed on
Aug 30, 2013
Sold by
Cronquist Chad
Bought by
Gneiting Natalie
Current Estimated Value
Purchase Details
Closed on
Oct 29, 2009
Sold by
Cronquist William K
Bought by
Cronquist Chad
Purchase Details
Closed on
Sep 1, 2009
Sold by
Cronquist Chad
Bought by
Cronquist William K
Purchase Details
Closed on
Jul 12, 2006
Sold by
Blackhawk Llc
Bought by
Cronquist Chad
Create a Home Valuation Report for This Property
The Home Valuation Report is an in-depth analysis detailing your home's value as well as a comparison with similar homes in the area
Home Values in the Area
Average Home Value in this Area
Purchase History
| Date | Buyer | Sale Price | Title Company |
|---|---|---|---|
| Gneiting Natalie | -- | Wasatch Land & Title | |
| Cronquist Chad | -- | Us Title Insurance Agency | |
| Cronquist William K | -- | Us Title Insurance Agency | |
| Cronquist Chad | -- | Quality Title |
Source: Public Records
Tax History Compared to Growth
Tax History
| Year | Tax Paid | Tax Assessment Tax Assessment Total Assessment is a certain percentage of the fair market value that is determined by local assessors to be the total taxable value of land and additions on the property. | Land | Improvement |
|---|---|---|---|---|
| 2025 | $2,489 | $488,000 | $187,400 | $300,600 |
| 2024 | $2,489 | $247,830 | $0 | $0 |
| 2023 | $2,550 | $254,705 | $0 | $0 |
| 2022 | $2,783 | $286,715 | $0 | $0 |
| 2021 | $1,145 | $361,700 | $90,600 | $271,100 |
| 2020 | $2,177 | $337,000 | $78,800 | $258,200 |
| 2019 | $1,916 | $303,300 | $78,800 | $224,500 |
| 2018 | $871 | $285,900 | $75,000 | $210,900 |
| 2017 | $579 | $140,910 | $0 | $0 |
| 2016 | $1,721 | $135,960 | $0 | $0 |
| 2015 | $1,644 | $127,435 | $0 | $0 |
| 2014 | $1,475 | $114,070 | $0 | $0 |
Source: Public Records
Map
Nearby Homes
- 1171 E 430 S
- 1143 E 430 S
- 1153 E 270 S
- 160 S 940 E
- 65 S 940 E
- 942 N 160 E
- 942 N 160 E Unit 22
- 521 E 550 S
- 78 N Peach St
- 124 N Peach St
- 931 N 160 E Unit 11
- 1500 S 5200 W
- 4400 S Highway 198
- 4300 S Highway 198
- 13460 S Highway 6
- 1134 W Hidden Dr
- 13600 W Chimney Rock Pass S
- 2151 N York Ln Unit 11
- 14717 S 5200 W
- 576 S 400 E