Estimated Value: $101,000 - $120,000
2
Beds
2
Baths
960
Sq Ft
$117/Sq Ft
Est. Value
About This Home
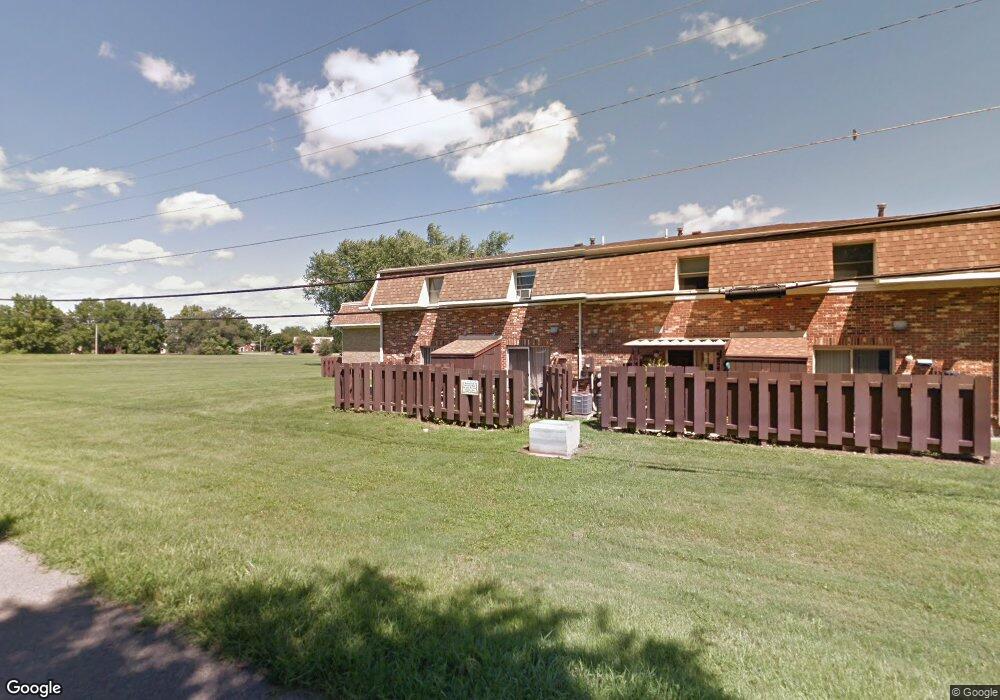
This home is located at 1046 Frederick Dr, Xenia, OH 45385 and is currently estimated at $112,077, approximately $116 per square foot. 1046 Frederick Dr is a home located in Greene County with nearby schools including Xenia High School, Summit Academy Community School for Alternative Learners - Xenia, and Legacy Christian Academy.
Ownership History
Date
Name
Owned For
Owner Type
Purchase Details
Closed on
Jul 15, 2021
Sold by
Soderberg Megan E
Bought by
Gary Wallman Llc
Current Estimated Value
Purchase Details
Closed on
Nov 16, 2018
Sold by
Murphy Neila C
Bought by
Soderberg Megan E
Home Financials for this Owner
Home Financials are based on the most recent Mortgage that was taken out on this home.
Original Mortgage
$47,500
Interest Rate
4.8%
Mortgage Type
New Conventional
Purchase Details
Closed on
Jan 5, 2016
Bought by
Murphy Neila C Trustee
Purchase Details
Closed on
Feb 11, 1999
Sold by
Murphy Robert and Murphy Neila C
Bought by
Murphy Robert and Murphy Neila C
Purchase Details
Closed on
May 19, 1998
Sold by
Williamson Sue A
Bought by
Murphy Robert and Murphy Neila C
Purchase Details
Closed on
Nov 19, 1997
Sold by
May Hannah
Bought by
Williamson Sue A
Create a Home Valuation Report for This Property
The Home Valuation Report is an in-depth analysis detailing your home's value as well as a comparison with similar homes in the area
Home Values in the Area
Average Home Value in this Area
Purchase History
| Date | Buyer | Sale Price | Title Company |
|---|---|---|---|
| Gary Wallman Llc | $85,000 | None Available | |
| Soderberg Megan E | $50,000 | None Available | |
| Murphy Neila C Trustee | -- | -- | |
| Murphy Robert | -- | -- | |
| Murphy Robert | $50,000 | -- | |
| Williamson Sue A | $41,000 | -- |
Source: Public Records
Mortgage History
| Date | Status | Borrower | Loan Amount |
|---|---|---|---|
| Previous Owner | Soderberg Megan E | $47,500 |
Source: Public Records
Tax History
| Year | Tax Paid | Tax Assessment Tax Assessment Total Assessment is a certain percentage of the fair market value that is determined by local assessors to be the total taxable value of land and additions on the property. | Land | Improvement |
|---|---|---|---|---|
| 2024 | $1,455 | $33,400 | $2,100 | $31,300 |
| 2023 | $1,429 | $33,400 | $2,100 | $31,300 |
| 2022 | $1,230 | $24,510 | $2,100 | $22,410 |
| 2021 | $875 | $17,210 | $2,100 | $15,110 |
| 2020 | $838 | $17,210 | $2,100 | $15,110 |
| 2019 | $556 | $10,740 | $2,100 | $8,640 |
| 2018 | $558 | $10,740 | $2,100 | $8,640 |
| 2017 | $568 | $10,740 | $2,100 | $8,640 |
| 2016 | $569 | $10,740 | $2,100 | $8,640 |
| 2015 | $570 | $10,740 | $2,100 | $8,640 |
| 2014 | $546 | $10,740 | $2,100 | $8,640 |
Source: Public Records
Map
Nearby Homes
- 878 N Detroit St
- 709 N West St
- 513 Redbud Ln
- 289 Hollywood Blvd
- 610 Saxony Dr
- 412 N King St
- 479 N Stadium Dr
- 603 Louise Dr
- 250 Helen Ave
- 119 Park Dr
- 167 Beverly Place
- 1359 Eagles Way
- 493 Hollywood Blvd
- 244 Edison Blvd
- 1790 Palmer Ct
- 1796 Palmer Ct
- 505 S Stadium Dr
- 1808 Palmer Ct
- 109 Outerview Cir
- 1872 Harris Ln
- 1044 Frederick Dr
- 1048 Frederick Dr
- 1042 Frederick Dr
- 1052 Frederick Dr
- 1040 Frederick Dr
- 1054 Frederick Dr
- 1056 Frederick Dr
- 1036 Frederick Dr
- 1034 Frederick Dr
- 1058 Frederick Dr
- 1032 Frederick Dr
- 1060 Frederick Dr
- 1062 Frederick Dr
- 1064 Frederick Dr
- 1066 Frederick Dr
- 1020 Frederick Dr
- 1022 Frederick Dr
- 1018 Frederick Dr
- 1024 Frederick Dr
- 1026 Frederick Dr
Your Personal Tour Guide
Ask me questions while you tour the home.