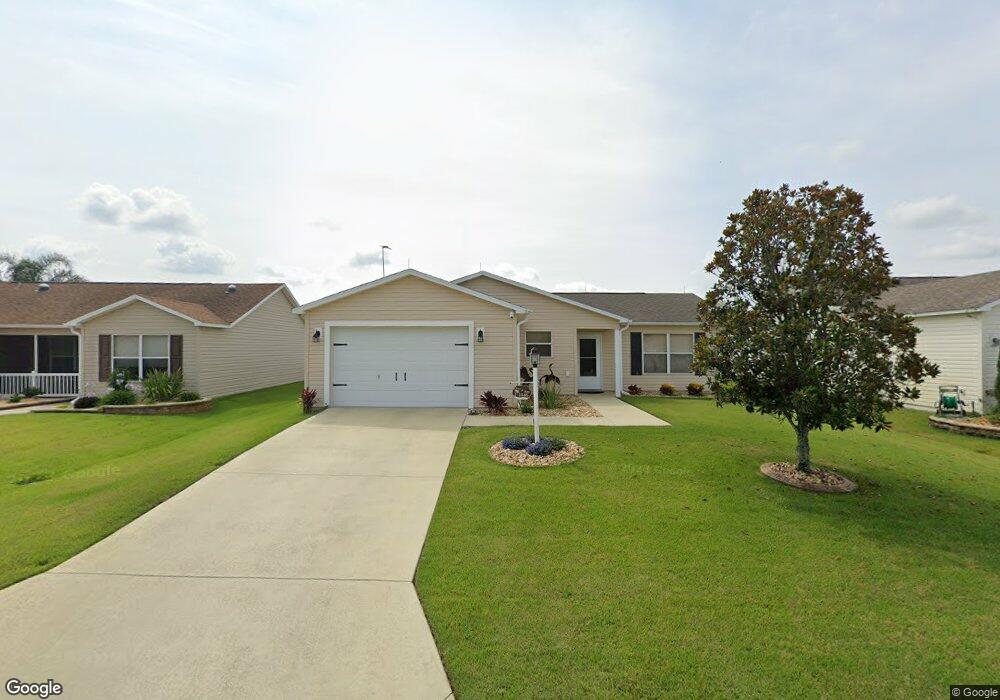
1046 Nash Loop Unit 138 The Villages, FL 32162
Village of Hemingway NeighborhoodEstimated Value: $305,000 - $341,000
3
Beds
2
Baths
1,405
Sq Ft
$232/Sq Ft
Est. Value
About This Home
This home is located at 1046 Nash Loop Unit 138, The Villages, FL 32162 and is currently estimated at $326,034, approximately $232 per square foot. 1046 Nash Loop Unit 138 is a home located in Sumter County with nearby schools including Wildwood Elementary School and Wildwood Middle/High School.
Ownership History
Date
Name
Owned For
Owner Type
Purchase Details
Closed on
Dec 28, 2022
Sold by
Crupi Anthony Eagan and Crupi Patricia Ann
Bought by
Crupi Anthony Eagan and Crupi Anthony Eagan
Current Estimated Value
Purchase Details
Closed on
Nov 9, 2016
Sold by
Dobbins Susan H
Bought by
Crupi Anthony E and Crupi Patricia A
Purchase Details
Closed on
Feb 6, 2014
Sold by
Dobbins Susan H
Bought by
Dobbins Susan H and Wilson Jaime Laasch
Purchase Details
Closed on
Dec 15, 2010
Sold by
Scarduzio Frank
Bought by
Dobbins Susan H
Purchase Details
Closed on
Jun 16, 2008
Sold by
The Villages Of Lake Sumter Inc
Bought by
Scarduzio Frank
Home Financials for this Owner
Home Financials are based on the most recent Mortgage that was taken out on this home.
Original Mortgage
$130,436
Interest Rate
6.04%
Mortgage Type
Purchase Money Mortgage
Create a Home Valuation Report for This Property
The Home Valuation Report is an in-depth analysis detailing your home's value as well as a comparison with similar homes in the area
Home Values in the Area
Average Home Value in this Area
Purchase History
| Date | Buyer | Sale Price | Title Company |
|---|---|---|---|
| Crupi Anthony Eagan | $100 | -- | |
| Crupi Anthony E | $192,000 | Advantage Title Llc | |
| Dobbins Susan H | -- | Attorney | |
| Dobbins Susan H | $164,500 | Advantage Title & Trust Llc | |
| Scarduzio Frank | $163,100 | Attorney |
Source: Public Records
Mortgage History
| Date | Status | Borrower | Loan Amount |
|---|---|---|---|
| Previous Owner | Scarduzio Frank | $130,436 |
Source: Public Records
Tax History Compared to Growth
Tax History
| Year | Tax Paid | Tax Assessment Tax Assessment Total Assessment is a certain percentage of the fair market value that is determined by local assessors to be the total taxable value of land and additions on the property. | Land | Improvement |
|---|---|---|---|---|
| 2024 | $3,129 | $253,790 | $33,480 | $220,310 |
| 2023 | $3,129 | $265,450 | $22,320 | $243,130 |
| 2022 | $2,793 | $235,530 | $22,260 | $213,270 |
| 2021 | $2,631 | $178,060 | $22,260 | $155,800 |
| 2020 | $2,931 | $198,970 | $16,740 | $182,230 |
| 2019 | $2,786 | $182,290 | $16,740 | $165,550 |
| 2018 | $2,336 | $158,170 | $16,740 | $141,430 |
| 2017 | $3,733 | $159,720 | $16,740 | $142,980 |
| 2016 | $2,821 | $120,860 | $0 | $0 |
| 2015 | $2,831 | $120,020 | $0 | $0 |
| 2014 | $2,963 | $119,070 | $0 | $0 |
Source: Public Records
Map
Nearby Homes
- 2552 Mariel Way
- 2516 Banning Ct
- 971 Margaux Trail
- 1001 Greyford Ln
- 2355 Glade Run
- 2377 Longbow Trail
- 892 Nash Loop
- 915 Chapman Loop
- 859 Chapman Loop
- 1135 Burke Ct
- 1098 Burnettown Place
- 1110 Burnettown Place
- 2418 Columbia Way
- 2378 Columbia Way
- 2495 Dundee Terrace
- 2361 India Hook Terrace
- 2454 Monroe Terrace
- 2739 Midland Terrace
- 2208 Pilar Place
- 1425 Hollyberry Place
- 1048 Nash Loop
- 1042 Nash Loop
- 2492 Knox Terrace
- 2496 Knox Terrace
- 2500 Knox Terrace
- 1052 Nash Loop
- 1038 Nash Loop
- 1041 Jace Place
- 1045 Nash Loop
- 1037 Jace Place
- 1049 Nash Loop
- 1041 Nash Loop
- 2508 Knox Terrace
- 1054 Nash Loop
- 1033 Jace Place
- 1034 Nash Loop
- 1028 Jace Place
- 1037 Nash Loop
- 2512 Knox Terrace
- 1029 Orrick Ln