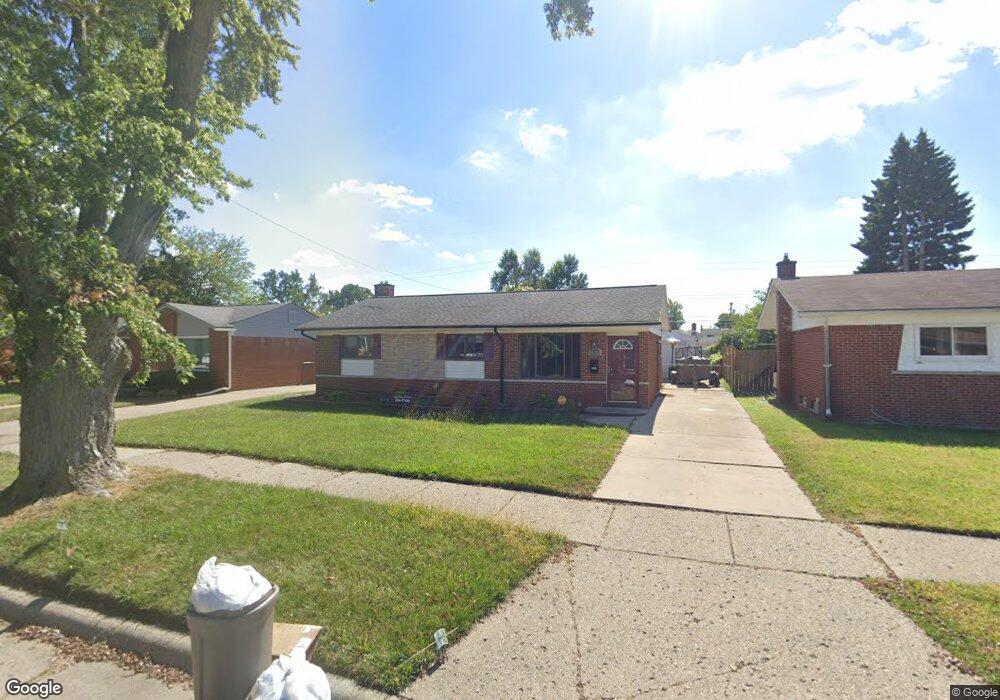
10461 N Oak Dr Ferndale, MI 48220
Estimated Value: $178,869 - $215,000
3
Beds
2
Baths
1,072
Sq Ft
$180/Sq Ft
Est. Value
About This Home
This home is located at 10461 N Oak Dr, Ferndale, MI 48220 and is currently estimated at $192,967, approximately $180 per square foot. 10461 N Oak Dr is a home located in Oakland County with nearby schools including Key Elementary School and Macdowell Preparatory Academy.
Ownership History
Date
Name
Owned For
Owner Type
Purchase Details
Closed on
Aug 30, 2019
Sold by
Reed Deborah A
Bought by
Robertson Torya C
Current Estimated Value
Home Financials for this Owner
Home Financials are based on the most recent Mortgage that was taken out on this home.
Original Mortgage
$82,450
Outstanding Balance
$72,367
Interest Rate
3.7%
Mortgage Type
New Conventional
Estimated Equity
$120,600
Purchase Details
Closed on
Aug 16, 2010
Sold by
Shamrock Acquisitions Llc
Bought by
Reed Deborah A
Purchase Details
Closed on
Feb 8, 2010
Sold by
Secretary Of Housing & Urban Development
Bought by
Shamrock Acquisitions Llc
Purchase Details
Closed on
Aug 19, 2009
Sold by
Midfirst Bank
Bought by
The Secretary Of Housing & Urban Develop
Purchase Details
Closed on
Feb 17, 2009
Sold by
Williams Duane F and Williams Penny
Bought by
Midfirst Bank
Purchase Details
Closed on
Jul 15, 1997
Sold by
Ford Harold
Bought by
Williams Dwayne
Create a Home Valuation Report for This Property
The Home Valuation Report is an in-depth analysis detailing your home's value as well as a comparison with similar homes in the area
Home Values in the Area
Average Home Value in this Area
Purchase History
| Date | Buyer | Sale Price | Title Company |
|---|---|---|---|
| Robertson Torya C | $85,000 | Rtn | |
| Reed Deborah A | $83,000 | Fidelity Natl Title Ins Co | |
| Shamrock Acquisitions Llc | $36,000 | None Available | |
| The Secretary Of Housing & Urban Develop | -- | None Available | |
| Midfirst Bank | $118,534 | None Available | |
| Williams Dwayne | $62,000 | -- |
Source: Public Records
Mortgage History
| Date | Status | Borrower | Loan Amount |
|---|---|---|---|
| Open | Robertson Torya C | $82,450 |
Source: Public Records
Tax History Compared to Growth
Tax History
| Year | Tax Paid | Tax Assessment Tax Assessment Total Assessment is a certain percentage of the fair market value that is determined by local assessors to be the total taxable value of land and additions on the property. | Land | Improvement |
|---|---|---|---|---|
| 2024 | $876 | $54,800 | $0 | $0 |
| 2023 | $836 | $47,670 | $0 | $0 |
| 2022 | $1,847 | $41,700 | $0 | $0 |
| 2021 | $1,273 | $35,910 | $0 | $0 |
| 2020 | $627 | $32,240 | $0 | $0 |
| 2019 | $1,741 | $26,340 | $0 | $0 |
| 2018 | $1,352 | $23,460 | $0 | $0 |
| 2017 | $1,326 | $22,300 | $0 | $0 |
| 2016 | $1,328 | $22,240 | $0 | $0 |
| 2015 | -- | $22,080 | $0 | $0 |
| 2014 | -- | $22,070 | $0 | $0 |
| 2011 | -- | $28,100 | $0 | $0 |
Source: Public Records
Map
Nearby Homes
- 10358 Cloverdale Ave
- 21326 Ithaca Ave
- 21056 Woodside Ave
- 21040 Woodside Ave
- 21032 Woodside Ave
- 20515 Mendota St
- 20525 Manor St
- 10631 Saratoga St
- 21395 Westview Ave
- 21433 Westview Ave
- 20495 Meyers Rd
- 20469 Manor St
- 8761 Albany St
- 20428 Monte Vista St
- 20484 Appoline St
- 20885 Westview Ave
- 10111 Corning St
- 20434 Meyers Rd
- 21341 Reimanville Ave
- 21036 Westview Ave
- 10503 N Oak Dr
- 10515 N Oak Dr
- 10449 N Oak Dr
- 10437 N Oak Dr
- 10462 Cloverdale Ave
- 10504 Cloverdale Ave
- 10527 N Oak Dr
- 10516 Cloverdale Ave
- 10450 Cloverdale Ave
- 10438 Cloverdale Ave
- 10464 N Oak Dr
- 10506 N Oak Dr
- 10452 N Oak Dr
- 10423 N Oak Dr
- 10440 N Oak Dr
- 10528 Cloverdale Ave
- 10539 N Oak Dr
- 10518 N Oak Dr
- 10411 N Oak Dr
- 10424 Cloverdale Ave