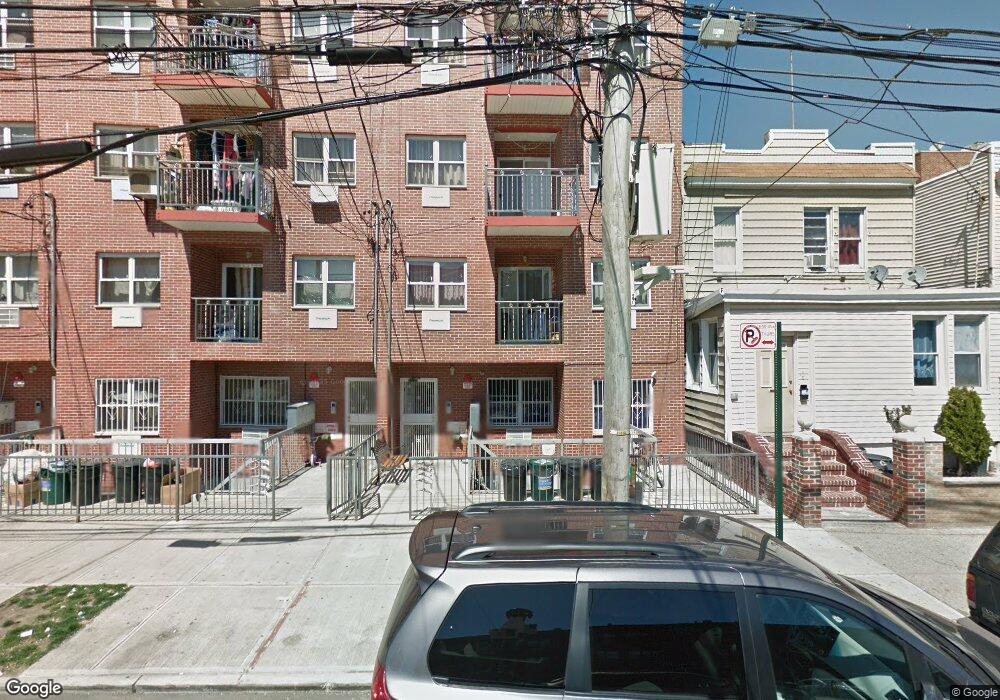
10463 38th Ave Unit 2B Corona, NY 11368
Corona NeighborhoodEstimated Value: $393,000 - $519,209
--
Bed
--
Bath
766
Sq Ft
$606/Sq Ft
Est. Value
About This Home
This home is located at 10463 38th Ave Unit 2B, Corona, NY 11368 and is currently estimated at $464,552, approximately $606 per square foot. 10463 38th Ave Unit 2B is a home located in Queens County with nearby schools including P.S. 143 Louis Armstrong, Is 61 Leonardo Da Vinci, and Flushing High School.
Ownership History
Date
Name
Owned For
Owner Type
Purchase Details
Closed on
Aug 20, 2020
Sold by
Morocho Nivicela Carlos Rodrigo and Morocho Nivichela Carlos
Bought by
Morocho Nivicela Carlos Rodrigo and Wang Fang
Current Estimated Value
Purchase Details
Closed on
Mar 31, 2020
Sold by
Chen Geng and Xiao Xiang Lian
Bought by
Morocho Nivichela Carlos Rodrigo and Wang Fang
Home Financials for this Owner
Home Financials are based on the most recent Mortgage that was taken out on this home.
Original Mortgage
$298,200
Interest Rate
3.2%
Mortgage Type
Unknown
Purchase Details
Closed on
Jan 17, 2012
Sold by
Gao Sheng Inc
Bought by
Chen Geng and Xiao Xiang Lian
Home Financials for this Owner
Home Financials are based on the most recent Mortgage that was taken out on this home.
Original Mortgage
$136,000
Interest Rate
3.94%
Mortgage Type
New Conventional
Create a Home Valuation Report for This Property
The Home Valuation Report is an in-depth analysis detailing your home's value as well as a comparison with similar homes in the area
Home Values in the Area
Average Home Value in this Area
Purchase History
| Date | Buyer | Sale Price | Title Company |
|---|---|---|---|
| Morocho Nivicela Carlos Rodrigo | -- | -- | |
| Morocho Nivichela Carlos Rodrigo | $497,000 | -- | |
| Chen Geng | $272,000 | -- |
Source: Public Records
Mortgage History
| Date | Status | Borrower | Loan Amount |
|---|---|---|---|
| Previous Owner | Morocho Nivichela Carlos Rodrigo | $298,200 | |
| Previous Owner | Chen Geng | $136,000 |
Source: Public Records
Tax History Compared to Growth
Tax History
| Year | Tax Paid | Tax Assessment Tax Assessment Total Assessment is a certain percentage of the fair market value that is determined by local assessors to be the total taxable value of land and additions on the property. | Land | Improvement |
|---|---|---|---|---|
| 2025 | $607 | $6,783 | $2,178 | $4,605 |
| 2024 | $607 | $6,783 | $2,614 | $4,169 |
| 2023 | $476 | $6,572 | $3,026 | $3,546 |
| 2022 | $341 | $42,469 | $19,294 | $23,175 |
| 2021 | $240 | $48,488 | $19,294 | $29,194 |
| 2020 | $244 | $53,213 | $19,294 | $33,919 |
| 2019 | $247 | $53,460 | $19,294 | $34,166 |
| 2018 | $249 | $5,055 | $1,459 | $3,596 |
| 2017 | $249 | $4,681 | $1,284 | $3,397 |
| 2016 | $253 | $4,681 | $1,284 | $3,397 |
| 2015 | $197 | $4,014 | $837 | $3,177 |
| 2014 | $197 | $4,014 | $670 | $3,344 |
Source: Public Records
Map
Nearby Homes
- 104-48 37th Dr Unit 3A
- 37-45 108th St
- 37-33 107th St Unit 4A
- 37-33 107th St Unit 2A
- 108-22 38th Ave
- 104-64 39th Ave Unit 3A
- 108-20 38th Ave
- 104-21 39th Ave Unit 211C
- 104-12 38th Ave
- 107-16 37th Ave Unit 4B
- 107-16 37th Ave Unit 3B
- 104-32 39th Ave
- 104-61 Roosevelt Ave
- 108-13 37th Ave
- 104-60 Roosevelt Ave
- 37-13 104th St
- 3730 103rd St Unit 2
- 37-30 103rd St Unit 2B
- 37-30 103rd St Unit D3
- 37-30 103rd St Unit 2E
- 104-63 38th Ave Unit 1B
- 104-63 38th Ave Unit 4B
- 104-63 38th Ave Unit 3A
- 104-63 38th Ave
- 104-63 38 Ave Unit 3B
- 10463 38th Ave Unit 4A
- 10463 38th Ave Unit 3A
- 10463 38th Ave Unit 1B
- 10463 38th Ave
- 10463 38th Ave Unit 3B
- 10463 38th Ave Unit 1A
- 10463 38th Ave Unit 2A
- 10463 38th Ave Unit 4B
- 10463 38th Ave Unit 104-63
- 10463 38th Ave Unit 2B
- 104-63 38th Ave Unit 2B
- 10467 38th Ave
- 104-61 38th Ave Unit 1B
- 104-61 38th Ave Unit 2B
- 104-61 38th Ave Unit 3A