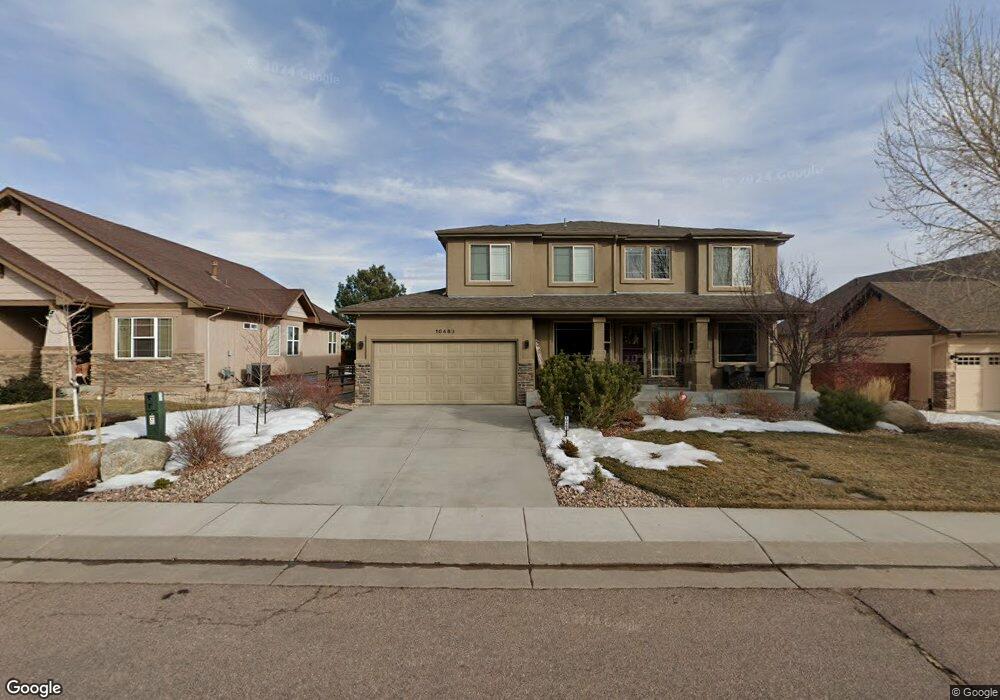
10463 Scotts Bluff Dr Peyton, CO 80831
Falcon NeighborhoodEstimated Value: $611,000 - $698,000
5
Beds
4
Baths
3,904
Sq Ft
$167/Sq Ft
Est. Value
About This Home
This home is located at 10463 Scotts Bluff Dr, Peyton, CO 80831 and is currently estimated at $650,373, approximately $166 per square foot. 10463 Scotts Bluff Dr is a home located in El Paso County with nearby schools including Meridian Ranch International School, Falcon Middle School, and Falcon High School.
Ownership History
Date
Name
Owned For
Owner Type
Purchase Details
Closed on
May 27, 2016
Sold by
Lesniak Mari P and Lesniak Miroslaw
Bought by
Lingle Terry K and Lingle Vicki L
Current Estimated Value
Home Financials for this Owner
Home Financials are based on the most recent Mortgage that was taken out on this home.
Original Mortgage
$392,540
Outstanding Balance
$312,622
Interest Rate
3.59%
Mortgage Type
VA
Estimated Equity
$337,751
Purchase Details
Closed on
May 26, 2006
Sold by
Vantage Homes Corp
Bought by
Lesniak Mari P and Lesniak Miroslaw
Home Financials for this Owner
Home Financials are based on the most recent Mortgage that was taken out on this home.
Original Mortgage
$352,315
Interest Rate
5.75%
Mortgage Type
Fannie Mae Freddie Mac
Purchase Details
Closed on
Sep 6, 2005
Sold by
Gtl Inc
Bought by
Vantage Homes Corp
Create a Home Valuation Report for This Property
The Home Valuation Report is an in-depth analysis detailing your home's value as well as a comparison with similar homes in the area
Home Values in the Area
Average Home Value in this Area
Purchase History
| Date | Buyer | Sale Price | Title Company |
|---|---|---|---|
| Lingle Terry K | $380,000 | Guardian Title | |
| Lesniak Mari P | $440,400 | Land Title Guarantee Company | |
| Vantage Homes Corp | $75,300 | Fahtco |
Source: Public Records
Mortgage History
| Date | Status | Borrower | Loan Amount |
|---|---|---|---|
| Open | Lingle Terry K | $392,540 | |
| Previous Owner | Lesniak Mari P | $352,315 |
Source: Public Records
Tax History Compared to Growth
Tax History
| Year | Tax Paid | Tax Assessment Tax Assessment Total Assessment is a certain percentage of the fair market value that is determined by local assessors to be the total taxable value of land and additions on the property. | Land | Improvement |
|---|---|---|---|---|
| 2025 | $4,266 | $44,560 | -- | -- |
| 2024 | $3,445 | $45,300 | $8,020 | $37,280 |
| 2022 | $2,415 | $30,880 | $6,280 | $24,600 |
| 2021 | $2,502 | $31,760 | $6,460 | $25,300 |
| 2020 | $2,497 | $29,920 | $5,850 | $24,070 |
| 2019 | $3,263 | $29,920 | $5,850 | $24,070 |
| 2018 | $2,955 | $26,820 | $5,360 | $21,460 |
| 2017 | $2,795 | $26,820 | $5,360 | $21,460 |
| 2016 | $3,126 | $30,720 | $5,920 | $24,800 |
| 2015 | $3,128 | $30,720 | $5,920 | $24,800 |
| 2014 | $2,932 | $28,440 | $5,370 | $23,070 |
Source: Public Records
Map
Nearby Homes
- 12238 Sleeping Bear Rd
- 10402 Capital Peak Way
- 10603 Ross Lake Dr
- 12252 Point Reyes Dr
- 10433 Capital Peak Way
- 12272 Isle Royale Dr
- 10429 Cedar Breaks Dr
- 10489 Cedar Breaks Dr
- 12223 Grand Teton Dr
- 10335 Antler Creek Dr
- 10368 Mount Evans Dr
- 10223 Capital Peak Way
- 10398 Mount Evans Dr
- 12256 Chimney Smoke Dr
- 12209 Anacostia Dr
- 12548 Stone Valley Dr
- 12459 Handles Peak Way
- 12216 Chimney Smoke Dr
- 10467 Pictured Rocks Dr
- 12547 Stone Valley Dr
- 10473 Scotts Bluff Dr
- 10453 Scotts Bluff Dr
- 10483 Scotts Bluff Dr
- 10443 Scotts Bluff Dr
- 10472 Scotts Bluff Dr
- 10462 Scotts Bluff Dr
- 10433 Scotts Bluff Dr
- 10452 Scotts Bluff Dr
- 12425 Angelina Dr
- 10442 Scotts Bluff Dr
- 10492 Scotts Bluff Dr
- 12435 Angelina Dr
- 10423 Scotts Bluff Dr
- 10422 Scotts Bluff Dr
- 12445 Angelina Dr
- 12424 Angelina Dr
- 12414 Angelina Dr
- 10412 Scotts Bluff Dr
- 10468 Ross Lake Dr
- 10460 Ross Lake Dr