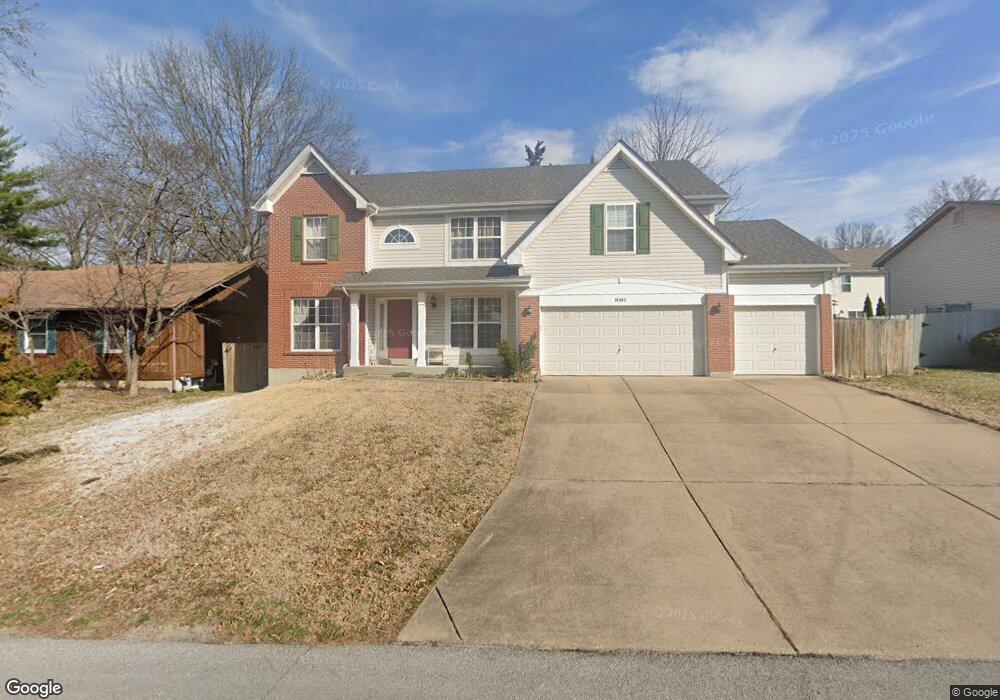
10465 Anzeiger Ave Saint Louis, MO 63131
Estimated Value: $823,000 - $961,000
4
Beds
3
Baths
3,104
Sq Ft
$286/Sq Ft
Est. Value
About This Home
This home is located at 10465 Anzeiger Ave, Saint Louis, MO 63131 and is currently estimated at $888,925, approximately $286 per square foot. 10465 Anzeiger Ave is a home located in St. Louis County with nearby schools including Ladue 5th Grade Center, Spoede Elementary School, and Ladue Middle School.
Ownership History
Date
Name
Owned For
Owner Type
Purchase Details
Closed on
Aug 28, 2013
Sold by
Wang Jeremy D and Tian Ying
Bought by
Ye Haiwei and He Ping
Current Estimated Value
Home Financials for this Owner
Home Financials are based on the most recent Mortgage that was taken out on this home.
Original Mortgage
$200,000
Outstanding Balance
$148,555
Interest Rate
4.36%
Mortgage Type
New Conventional
Estimated Equity
$740,370
Purchase Details
Closed on
Feb 17, 2004
Sold by
Mayer Custome Homes Inc
Bought by
Wang Jeremy D and Tian Ying
Home Financials for this Owner
Home Financials are based on the most recent Mortgage that was taken out on this home.
Original Mortgage
$260,000
Interest Rate
4.25%
Mortgage Type
Purchase Money Mortgage
Purchase Details
Closed on
Jun 2, 2003
Sold by
Maierhoffer Jayne M
Bought by
Mayer Custom Homes Inc
Create a Home Valuation Report for This Property
The Home Valuation Report is an in-depth analysis detailing your home's value as well as a comparison with similar homes in the area
Home Values in the Area
Average Home Value in this Area
Purchase History
| Date | Buyer | Sale Price | Title Company |
|---|---|---|---|
| Ye Haiwei | $416,000 | Orntic St Louis | |
| Wang Jeremy D | $437,313 | -- | |
| Mayer Custom Homes Inc | $140,000 | -- |
Source: Public Records
Mortgage History
| Date | Status | Borrower | Loan Amount |
|---|---|---|---|
| Open | Ye Haiwei | $200,000 | |
| Previous Owner | Wang Jeremy D | $260,000 |
Source: Public Records
Tax History
| Year | Tax Paid | Tax Assessment Tax Assessment Total Assessment is a certain percentage of the fair market value that is determined by local assessors to be the total taxable value of land and additions on the property. | Land | Improvement |
|---|---|---|---|---|
| 2025 | $8,957 | $142,750 | $46,320 | $96,430 |
| 2024 | $8,957 | $130,860 | $42,470 | $88,390 |
| 2023 | $8,946 | $130,860 | $42,470 | $88,390 |
| 2022 | $8,889 | $125,040 | $46,320 | $78,720 |
| 2021 | $8,837 | $125,040 | $46,320 | $78,720 |
| 2020 | $8,416 | $128,970 | $34,730 | $94,240 |
| 2019 | $7,142 | $111,050 | $34,730 | $76,320 |
| 2018 | $6,514 | $93,400 | $24,680 | $68,720 |
| 2016 | $5,709 | $79,410 | $23,090 | $56,320 |
Source: Public Records
Map
Nearby Homes
- 10340 Savannah Ave
- 14 Ballantrae Ct
- 11 Chatfield Place Rd
- 849 Bluespring Ln
- 10067 Springwood Dr
- 9 Warson Terrace
- 44 Picardy Ln
- 15 Lawrence Dr
- 132 Mystic Meadows Ln
- 31 Conway Close Rd
- 1139 Enclave Ct
- 1691 Frontenac Woods Ln
- 111 N Mosley Rd
- 10 Country Estates Place
- 1 Allegro Ln
- 2 Country Estates Place
- 436 Tregaron Place
- 31 Midpark Ln
- 210 New Salem Dr
- 8 Bridle Ln
- 10459 Anzeiger Ave
- 10471 Anzeiger Ave
- 10470 Garibaldi-Uc
- 10470 Garibaldi Place
- 10468 Garibaldi Place
- 10474 Garibaldi Place
- 10466 Anzeiger Ave
- 10449 Anzeiger Ave
- 10460 Anzeiger Ave
- 10454 Gaibaldi
- 10472 Anzeiger Ave
- 10454 Garibaldi Place
- 10452 Anzeiger Ave
- 10445 Anzeiger Ave
- 10450 Anzeiger Ave
- 10471 Garibaldi Place
- 10469 Savannah Ave
- 10452 Garibaldi Place
- 10477 Garibaldi Place
- 10467 Savannah Ave
Your Personal Tour Guide
Ask me questions while you tour the home.