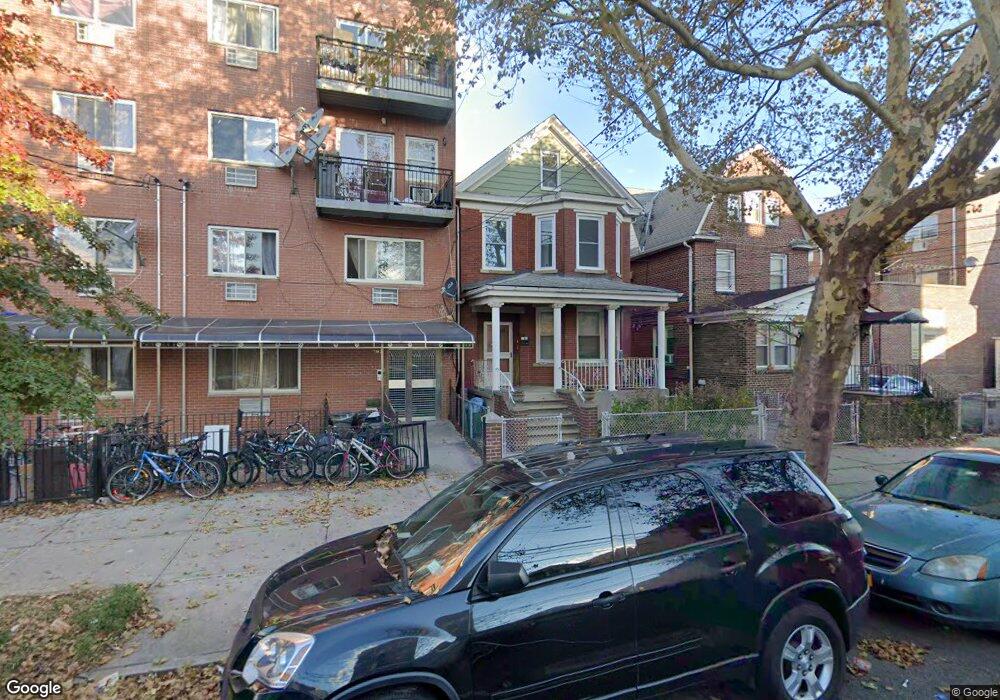
10467 39th Ave Corona, NY 11368
Corona NeighborhoodEstimated Value: $1,105,369 - $1,458,000
3
Beds
2
Baths
2,099
Sq Ft
$613/Sq Ft
Est. Value
About This Home
This home is located at 10467 39th Ave, Corona, NY 11368 and is currently estimated at $1,286,592, approximately $612 per square foot. 10467 39th Ave is a home located in Queens County with nearby schools including P.S. 16 the Nancy Debenedittis School, Is 61 Leonardo Da Vinci, and Flushing High School.
Ownership History
Date
Name
Owned For
Owner Type
Purchase Details
Closed on
Mar 23, 2022
Sold by
Garcia Ileana
Bought by
Miniguano Irene and Valladolid Escriba Jesus
Current Estimated Value
Home Financials for this Owner
Home Financials are based on the most recent Mortgage that was taken out on this home.
Original Mortgage
$1,062,400
Outstanding Balance
$988,706
Interest Rate
3.89%
Mortgage Type
Purchase Money Mortgage
Estimated Equity
$297,886
Purchase Details
Closed on
Oct 19, 2005
Sold by
Castelli Eleanor and Castelli John
Bought by
Garcia Ileana
Home Financials for this Owner
Home Financials are based on the most recent Mortgage that was taken out on this home.
Original Mortgage
$420,000
Interest Rate
5.85%
Mortgage Type
Purchase Money Mortgage
Purchase Details
Closed on
Jun 8, 2005
Sold by
Claus Helen
Bought by
Castelli Eleanor and Castelli John
Purchase Details
Closed on
Feb 16, 1998
Sold by
Castelli John and Castelli Eleanor
Bought by
Claus Helen
Create a Home Valuation Report for This Property
The Home Valuation Report is an in-depth analysis detailing your home's value as well as a comparison with similar homes in the area
Home Values in the Area
Average Home Value in this Area
Purchase History
| Date | Buyer | Sale Price | Title Company |
|---|---|---|---|
| Miniguano Irene | $1,328,000 | -- | |
| Miniguano Irene | $1,328,000 | -- | |
| Miniguano Irene | $1,328,000 | -- | |
| Garcia Ileana | $570,000 | -- | |
| Garcia Ileana | $570,000 | -- | |
| Castelli Eleanor | -- | -- | |
| Castelli Eleanor | -- | -- | |
| Claus Helen | -- | -- | |
| Claus Helen | -- | -- |
Source: Public Records
Mortgage History
| Date | Status | Borrower | Loan Amount |
|---|---|---|---|
| Open | Miniguano Irene | $1,062,400 | |
| Closed | Miniguano Irene | $1,062,400 | |
| Previous Owner | Garcia Ileana | $420,000 |
Source: Public Records
Tax History
| Year | Tax Paid | Tax Assessment Tax Assessment Total Assessment is a certain percentage of the fair market value that is determined by local assessors to be the total taxable value of land and additions on the property. | Land | Improvement |
|---|---|---|---|---|
| 2025 | $7,168 | $37,763 | $6,166 | $31,597 |
| 2024 | $7,168 | $35,686 | $6,861 | $28,825 |
| 2023 | $7,168 | $35,686 | $6,098 | $29,588 |
| 2022 | $6,393 | $67,320 | $12,540 | $54,780 |
| 2021 | $2,851 | $67,080 | $12,540 | $54,540 |
| 2020 | $2,671 | $64,560 | $12,540 | $52,020 |
| 2019 | $2,451 | $59,760 | $12,540 | $47,220 |
| 2018 | $2,372 | $29,738 | $5,749 | $23,989 |
| 2017 | $2,354 | $29,438 | $6,897 | $22,541 |
| 2016 | $2,157 | $29,438 | $6,897 | $22,541 |
| 2015 | $3,130 | $26,224 | $8,953 | $17,271 |
| 2014 | $3,130 | $24,782 | $9,232 | $15,550 |
Source: Public Records
Map
Nearby Homes
- 104-48 37th Dr Unit 3A
- 108-22 38th Ave
- 108-20 38th Ave
- 104-44 38th Ave
- 3733 107th St Unit 4A
- 37-33 107th St Unit 2A
- 10815 37th Dr Unit 4B
- 10716 37th Ave Unit 3B
- 104-37 37th Rd
- 104-21 39th Ave Unit 211C
- 104-61 Roosevelt Ave
- 10432 39th Ave
- 104-29 Roosevelt Ave
- 10460 Roosevelt Ave
- 37-21 104th St
- 10876 38th Ave
- 35-18 108th St
- 37-13 104th St
- 34-46 107th St
- 35-14 109th St
- 10467 39th Ave Unit 2
- 10467 39th Ave
- 10469 39th Ave
- 10463 39th Ave
- 10461 39th Ave
- 10459 39th Ave
- 3822 108th St Unit 3A
- 3822 108th St Unit 2B
- 3822 108th St Unit 2A
- 3822 108th St Unit 1A
- 3822 108th St
- 3822 108th St
- 3820 108th St Unit 3A
- 3820 108th St Unit 2B
- 3820 108th St Unit 2A
- 3820 108th St Unit 1A
- 3820 108th St
- 104-55 39th Ave
- 3816 108th St
- 10455 39th Ave
Your Personal Tour Guide
Ask me questions while you tour the home.