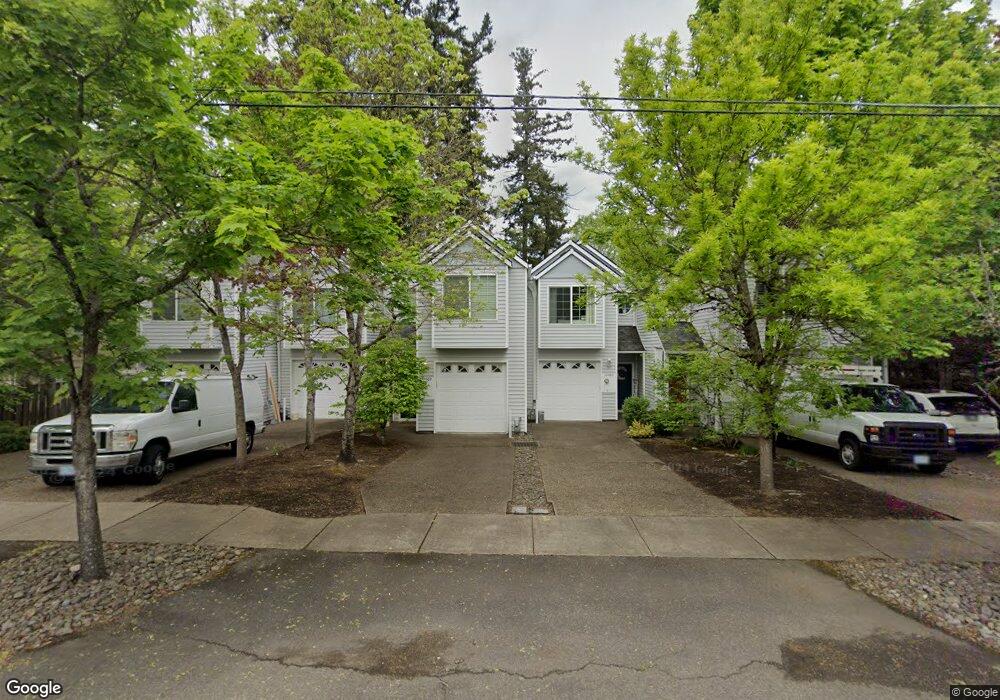
10469 SW Laurel Rd Beaverton, OR 97005
Estimated Value: $397,117 - $472,000
2
Beds
3
Baths
1,465
Sq Ft
$297/Sq Ft
Est. Value
About This Home
This home is located at 10469 SW Laurel Rd, Beaverton, OR 97005 and is currently estimated at $435,279, approximately $297 per square foot. 10469 SW Laurel Rd is a home located in Washington County with nearby schools including Raleigh Park Elementary School, Whitford Middle School, and Beaverton High School.
Ownership History
Date
Name
Owned For
Owner Type
Purchase Details
Closed on
Jul 10, 2008
Sold by
Bertell Teri Lynn
Bought by
Hockema Jennifer E
Current Estimated Value
Home Financials for this Owner
Home Financials are based on the most recent Mortgage that was taken out on this home.
Original Mortgage
$239,850
Outstanding Balance
$154,499
Interest Rate
6.04%
Mortgage Type
Unknown
Estimated Equity
$280,780
Purchase Details
Closed on
Mar 20, 2001
Sold by
Pacific Northwest Development Corp
Bought by
Bertell Teri Lynn
Home Financials for this Owner
Home Financials are based on the most recent Mortgage that was taken out on this home.
Original Mortgage
$152,550
Interest Rate
6.97%
Create a Home Valuation Report for This Property
The Home Valuation Report is an in-depth analysis detailing your home's value as well as a comparison with similar homes in the area
Home Values in the Area
Average Home Value in this Area
Purchase History
| Date | Buyer | Sale Price | Title Company |
|---|---|---|---|
| Hockema Jennifer E | $252,500 | Transnation Title Agency Or | |
| Bertell Teri Lynn | $169,500 | Fidelity National Title Ins |
Source: Public Records
Mortgage History
| Date | Status | Borrower | Loan Amount |
|---|---|---|---|
| Open | Hockema Jennifer E | $239,850 | |
| Previous Owner | Bertell Teri Lynn | $152,550 |
Source: Public Records
Tax History Compared to Growth
Tax History
| Year | Tax Paid | Tax Assessment Tax Assessment Total Assessment is a certain percentage of the fair market value that is determined by local assessors to be the total taxable value of land and additions on the property. | Land | Improvement |
|---|---|---|---|---|
| 2025 | $4,421 | $244,120 | -- | -- |
| 2024 | $4,151 | $237,010 | -- | -- |
| 2023 | $4,151 | $230,110 | $0 | $0 |
| 2022 | $4,017 | $230,110 | $0 | $0 |
| 2021 | $3,872 | $216,910 | $0 | $0 |
| 2020 | $3,756 | $210,600 | $0 | $0 |
| 2019 | $3,633 | $204,470 | $0 | $0 |
| 2018 | $3,514 | $198,520 | $0 | $0 |
| 2017 | $3,388 | $192,740 | $0 | $0 |
| 2016 | $3,144 | $187,130 | $0 | $0 |
| 2015 | $3,141 | $181,680 | $0 | $0 |
| 2014 | $3,002 | $176,390 | $0 | $0 |
Source: Public Records
Map
Nearby Homes
- 4180 SW 103rd Ct
- 10090 SW Beaverton Hillsdale Hwy Unit 13
- 4800 SW Chestnut Place
- 3525 SW 106th Ave
- 4060 SW 96th Ave
- 9360 SW Meadow Ln
- 3400 SW 110th Ave
- 11075 SW Cabot St
- 9355 SW Jamieson Rd
- 3345 SW 97th Ave
- 3370 SW Vista Dr
- 9001 SW Robert Gray Ln
- 11895 SW 3rd St
- 8955 SW Club Meadow Ln
- 3380 SW 116th Ave
- 8885 SW White Pine Ln
- 11345 SW Jody St
- 11755 SW 9th St
- 11925 SW 7th St
- 8725 SW White Pine Ln
- 10475 SW Laurel Rd
- 10463 SW Laurel Rd
- 10481 SW Laurel Rd
- 10457 SW Laurel Rd
- 10451 SW Laurel Rd
- 10505 SW Laurel Rd
- 10535 SW Laurel Rd
- 10375 SW Laurel Rd
- 10520 SW Laurel Rd
- 10540 SW Laurel Rd
- 4395 SW 103rd Ave
- 10575 SW Laurel Rd
- 10333 SW Laurel Rd
- 4375 SW 103rd Ave
- 4410 SW 107th Ave
- 4335 SW 103rd Ave
- 10540 SW Kennedy St
- 10420 SW Kennedy St
- 10380 SW Kennedy St
- 10580 SW Kennedy St