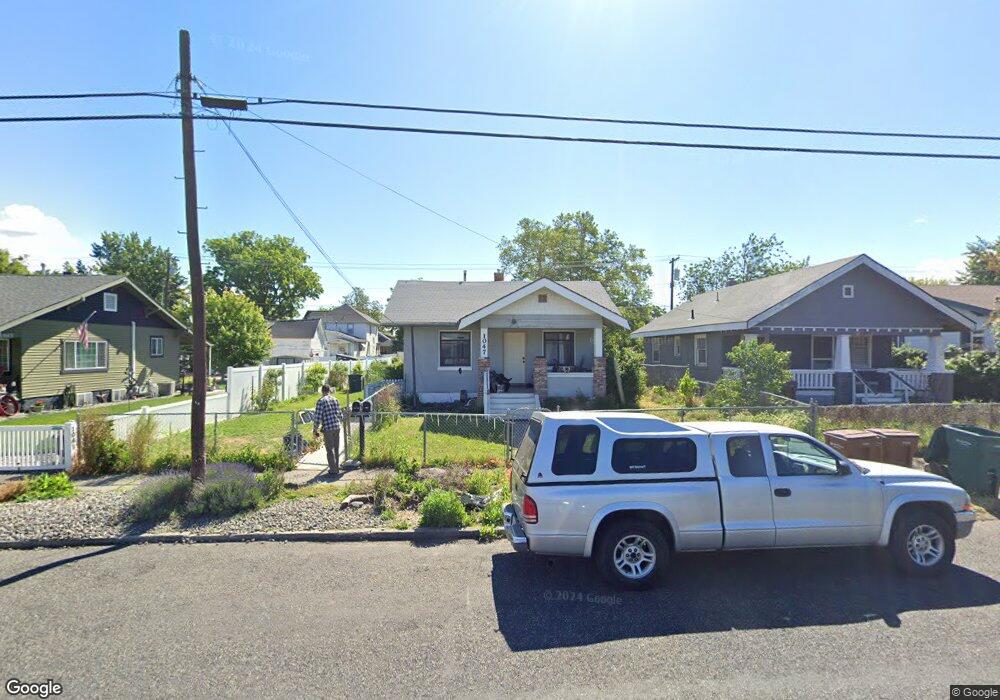
1047 8th St Clarkston, WA 99403
Estimated Value: $306,446 - $320,000
4
Beds
2
Baths
1,755
Sq Ft
$179/Sq Ft
Est. Value
About This Home
This home is located at 1047 8th St, Clarkston, WA 99403 and is currently estimated at $314,112, approximately $178 per square foot. 1047 8th St is a home located in Asotin County with nearby schools including Parkway Elementary School, Lincoln Middle School, and Charles Francis Adams High School.
Ownership History
Date
Name
Owned For
Owner Type
Purchase Details
Closed on
Jan 5, 2023
Sold by
Moen Susan Othella
Bought by
Moen David Benjamin
Current Estimated Value
Purchase Details
Closed on
Mar 25, 2021
Sold by
Roueche Paul M and Roueche Pamela C
Bought by
Moen Susan O
Home Financials for this Owner
Home Financials are based on the most recent Mortgage that was taken out on this home.
Original Mortgage
$187,000
Interest Rate
2.9%
Mortgage Type
New Conventional
Purchase Details
Closed on
Sep 18, 2020
Sold by
Par Investments Llc
Bought by
Roueche Pamela C and Roueche Paul Mn
Purchase Details
Closed on
Sep 11, 2014
Sold by
Day Douglas A and Day Nancy E
Bought by
Par Investments Llc
Create a Home Valuation Report for This Property
The Home Valuation Report is an in-depth analysis detailing your home's value as well as a comparison with similar homes in the area
Home Values in the Area
Average Home Value in this Area
Purchase History
| Date | Buyer | Sale Price | Title Company |
|---|---|---|---|
| Moen David Benjamin | -- | Alliance Title | |
| Moen Susan O | $220,000 | Alliance Title Clarkston | |
| Roueche Pamela C | -- | None Available | |
| Par Investments Llc | $145,000 | Alliance Title & Escrow |
Source: Public Records
Mortgage History
| Date | Status | Borrower | Loan Amount |
|---|---|---|---|
| Previous Owner | Moen Susan O | $187,000 |
Source: Public Records
Tax History Compared to Growth
Tax History
| Year | Tax Paid | Tax Assessment Tax Assessment Total Assessment is a certain percentage of the fair market value that is determined by local assessors to be the total taxable value of land and additions on the property. | Land | Improvement |
|---|---|---|---|---|
| 2025 | $2,398 | $206,200 | $30,000 | $176,200 |
| 2023 | $2,398 | $206,200 | $30,000 | $176,200 |
| 2022 | $2,368 | $206,200 | $30,000 | $176,200 |
| 2021 | $1,544 | $206,200 | $30,000 | $176,200 |
| 2020 | $1,379 | $122,500 | $31,000 | $91,500 |
| 2019 | $1,334 | $122,500 | $31,000 | $91,500 |
| 2018 | $1,612 | $122,500 | $31,000 | $91,500 |
| 2017 | $1,511 | $122,500 | $31,000 | $91,500 |
| 2016 | $1,511 | $122,500 | $31,000 | $91,500 |
| 2015 | $150 | $114,100 | $31,000 | $83,100 |
| 2013 | $1,453 | $111,700 | $31,000 | $80,700 |
Source: Public Records
Map
Nearby Homes