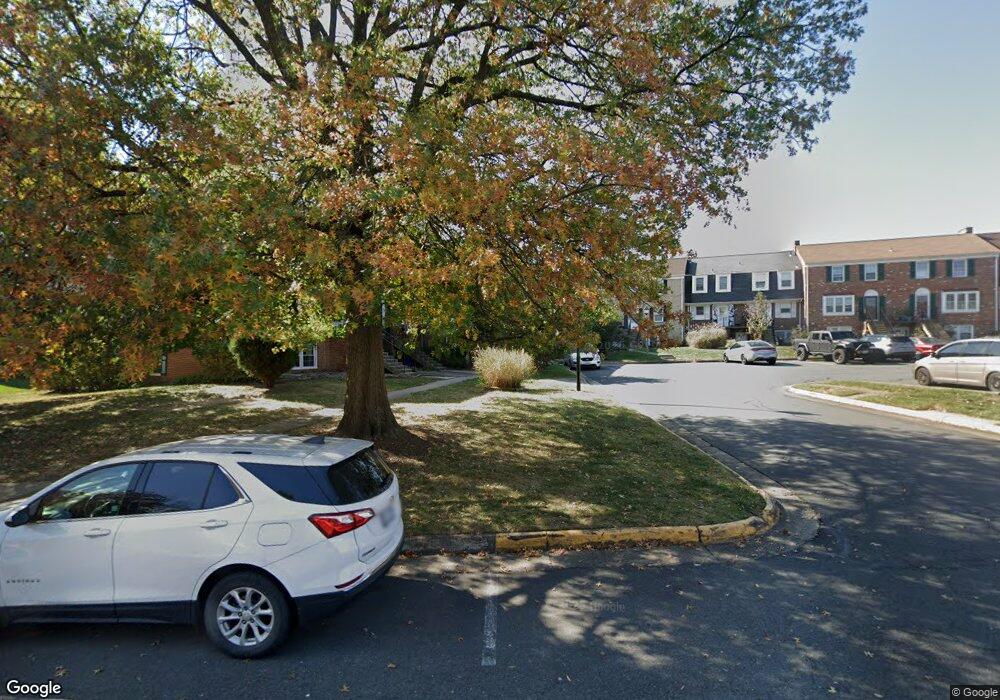
1047 Brixton Ct Unit B Sterling, VA 20164
Estimated Value: $367,000 - $378,000
3
Beds
3
Baths
1,338
Sq Ft
$278/Sq Ft
Est. Value
About This Home
This home is located at 1047 Brixton Ct Unit B, Sterling, VA 20164 and is currently estimated at $371,981, approximately $278 per square foot. 1047 Brixton Ct Unit B is a home located in Loudoun County with nearby schools including Guilford Elementary School, Sterling Middle School, and Park View High School.
Ownership History
Date
Name
Owned For
Owner Type
Purchase Details
Closed on
Nov 27, 2018
Sold by
Dubon Jose W and Henriquez Otero Marcos
Bought by
Cortez De Cid Luiz Ernesto and Amaya Fuentes Belinda Soledad
Current Estimated Value
Home Financials for this Owner
Home Financials are based on the most recent Mortgage that was taken out on this home.
Original Mortgage
$240,562
Outstanding Balance
$211,940
Interest Rate
4.8%
Mortgage Type
FHA
Estimated Equity
$160,041
Purchase Details
Closed on
Apr 26, 2016
Bought by
Tu Thuan M
Home Financials for this Owner
Home Financials are based on the most recent Mortgage that was taken out on this home.
Original Mortgage
$233,000
Interest Rate
3.59%
Purchase Details
Closed on
Nov 11, 2014
Sold by
Morabito Susan J
Bought by
Dubon Jose W and Otero Marcos H
Home Financials for this Owner
Home Financials are based on the most recent Mortgage that was taken out on this home.
Original Mortgage
$206,196
Interest Rate
4.17%
Mortgage Type
FHA
Create a Home Valuation Report for This Property
The Home Valuation Report is an in-depth analysis detailing your home's value as well as a comparison with similar homes in the area
Home Values in the Area
Average Home Value in this Area
Purchase History
| Date | Buyer | Sale Price | Title Company |
|---|---|---|---|
| Cortez De Cid Luiz Ernesto | $245,000 | Jdm Title Llc | |
| Tu Thuan M | -- | -- | |
| Dubon Jose W | $210,000 | -- |
Source: Public Records
Mortgage History
| Date | Status | Borrower | Loan Amount |
|---|---|---|---|
| Open | Cortez De Cid Luiz Ernesto | $240,562 | |
| Previous Owner | Tu Thuan M | $233,000 | |
| Previous Owner | Tu Thuan M | -- | |
| Previous Owner | Dubon Jose W | $206,196 |
Source: Public Records
Tax History Compared to Growth
Tax History
| Year | Tax Paid | Tax Assessment Tax Assessment Total Assessment is a certain percentage of the fair market value that is determined by local assessors to be the total taxable value of land and additions on the property. | Land | Improvement |
|---|---|---|---|---|
| 2025 | $2,544 | $316,050 | $110,000 | $206,050 |
| 2024 | $3,029 | $350,210 | $100,000 | $250,210 |
| 2023 | $3,000 | $342,850 | $100,000 | $242,850 |
| 2022 | $2,795 | $314,020 | $80,000 | $234,020 |
| 2021 | $2,588 | $264,040 | $80,000 | $184,040 |
| 2020 | $2,615 | $252,640 | $70,000 | $182,640 |
| 2019 | $2,447 | $234,210 | $60,000 | $174,210 |
| 2018 | $2,424 | $223,370 | $60,000 | $163,370 |
| 2017 | $2,447 | $217,480 | $60,000 | $157,480 |
| 2016 | $2,456 | $214,540 | $0 | $0 |
| 2015 | $2,418 | $153,070 | $0 | $153,070 |
| 2014 | $2,192 | $129,790 | $0 | $129,790 |
Source: Public Records
Map
Nearby Homes
- 1049B Brixton Ct Unit B
- 1048A Margate Ct
- 1048A Brixton Ct
- 1028A Brixton Ct
- 901 Holborn Ct
- 1030 Salisbury Ct
- 1034 Salisbury Ct
- 920 Windsor Ct
- 1008 Temple Ct
- 1081 Tottenham Ct
- 1029 S Ironwood Rd
- 1006 S Greenthorn Ave
- 935 Sherwood Ct
- 1006 S Ironwood Rd
- 1050 Ramsgate Ct Unit C
- 45458 Oak Trail Square
- 801 S Filbert Ct
- 100 W Poplar Rd
- 45401 Daveno Square
- 905 W Poplar Rd
- 1047A Brixton Ct
- 1047 Brixton Ct
- 1047 Brixton Ct
- 1047 Brixton Ct Unit A
- 1047A Brixton Ct Unit 1047A
- 1047A Brixton Ct Unit A
- 1047 Brixton Court C
- 1047 Brixton Ct Unit 1047A
- 1047 Brixton Court A Unit A
- 1047 Brixton Court A Unit 1047A
- 1047B Brixton Ct
- 1049 Brixton Court C Unit C
- 1049 Brixton Court C
- 1045B Brixton Ct
- 1045 Brixton Court B
- 1045 Brixton Court A Unit 1045A
- 1045 Brixton Court A Unit A
- 1045A Brixton Ct
- 1045A Brixton Ct Unit 1045A
- 1045A Brixton Ct Unit A