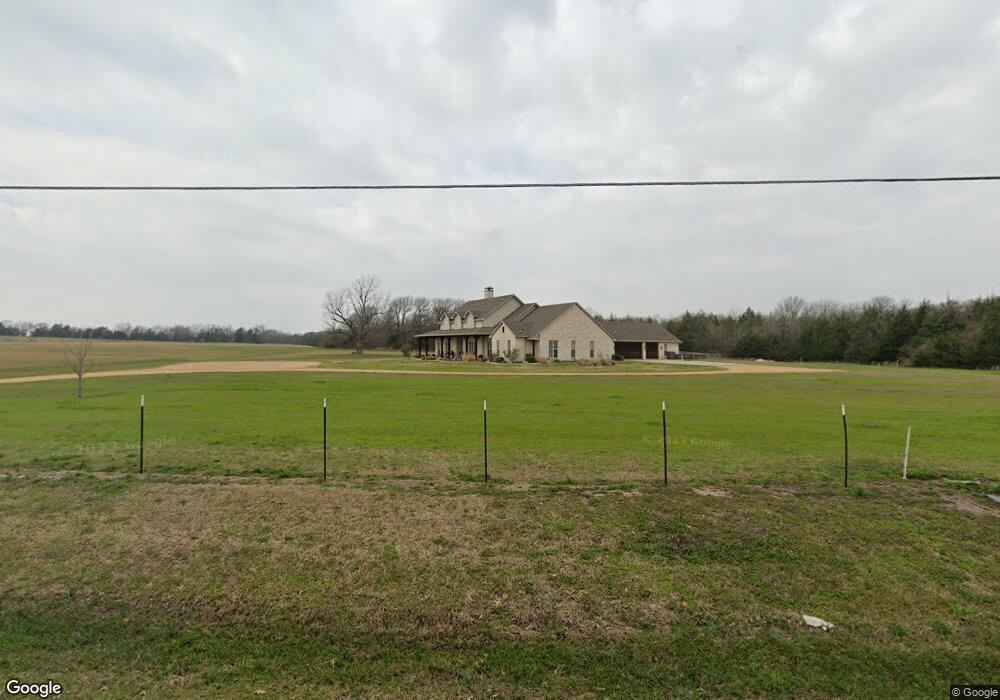
1047 Brown Rd Sherman, TX 75090
Estimated Value: $801,000 - $1,026,603
3
Beds
5
Baths
3,762
Sq Ft
$243/Sq Ft
Est. Value
About This Home
This home is located at 1047 Brown Rd, Sherman, TX 75090 and is currently estimated at $913,802, approximately $242 per square foot. 1047 Brown Rd is a home located in Grayson County with nearby schools including Percy W. Neblett Elementary School, Dillingham Intermediate School, and Piner Middle School.
Ownership History
Date
Name
Owned For
Owner Type
Purchase Details
Closed on
Jun 3, 2024
Sold by
Click Starlin Neal and Click Kayla Marie
Bought by
Click Family Revocable Trust and Click
Current Estimated Value
Purchase Details
Closed on
Mar 13, 2009
Sold by
Brown Jon L and Brown Lavonda L
Bought by
Click Starlin Neal and Click Kayla
Create a Home Valuation Report for This Property
The Home Valuation Report is an in-depth analysis detailing your home's value as well as a comparison with similar homes in the area
Home Values in the Area
Average Home Value in this Area
Purchase History
| Date | Buyer | Sale Price | Title Company |
|---|---|---|---|
| Click Family Revocable Trust | -- | None Listed On Document | |
| Click Starlin Neal | -- | Chapin Title Co Inc |
Source: Public Records
Tax History Compared to Growth
Tax History
| Year | Tax Paid | Tax Assessment Tax Assessment Total Assessment is a certain percentage of the fair market value that is determined by local assessors to be the total taxable value of land and additions on the property. | Land | Improvement |
|---|---|---|---|---|
| 2025 | $5,735 | $627,329 | -- | -- |
| 2024 | $9,633 | $570,319 | $0 | $0 |
| 2023 | $5,461 | $518,658 | $0 | $0 |
| 2022 | $8,855 | $471,591 | $0 | $0 |
| 2021 | $8,672 | $428,837 | $8,266 | $420,571 |
| 2020 | $9,146 | $427,294 | $15,266 | $412,028 |
| 2019 | $10,776 | $473,949 | $11,519 | $462,430 |
| 2018 | $9,591 | $459,498 | $11,533 | $447,965 |
| 2017 | $9,493 | $451,773 | $10,879 | $440,894 |
| 2016 | $10,101 | $482,700 | $65,715 | $416,985 |
| 2015 | $0 | $469,681 | $39,145 | $430,536 |
| 2014 | -- | $447,087 | $39,149 | $407,938 |
Source: Public Records
Map
Nearby Homes
- TBD 1 Dripping Spring Rd
- 4605 Dripping Spring Rd
- 4517 Playa Ct
- 4604 Bello Vista Cir
- 5585 S Fannin Ave
- 3426 Tomahawk Dr
- 3421 Tomahawk Dr
- 3422 Tomahawk Dr
- 3416 Rendezvous Way
- 3417 Tomahawk Dr
- 3413 Tomahawk Dr
- 3410 Tomahawk Dr
- 3409 Tomahawk Dr
- 3406 Tomahawk Dr
- 3405 Tomahawk Dr
- 4400 Carnation Dr
- 4408 Carnation Dr
- 4404 Carnation Dr
- 4412 Carnation Dr
- 4322 Carnation Dr
- 1022 Brown Rd
- 860 Brown Rd
- TBD Brown Rd
- 788 Brown Rd
- 649 Brown Rd
- 4648 Dripping Springs Rd
- 920 Brown Rd
- 4514 Dripping Springs Rd
- 49 Barbara Ln
- 4730 Dripping Springs Rd
- 4440 Dripping Springs Rd
- 4824 Dripping Springs Rd
- 112 Barbara Ln
- 529 Brown St
- 529 Brown Rd
- 5100 Playa Dr
- 111 Barbara Ln
- 10+ AC Dripping Springs Rd
- 4513 Dripping Springs Rd
- 5101 Playa Dr