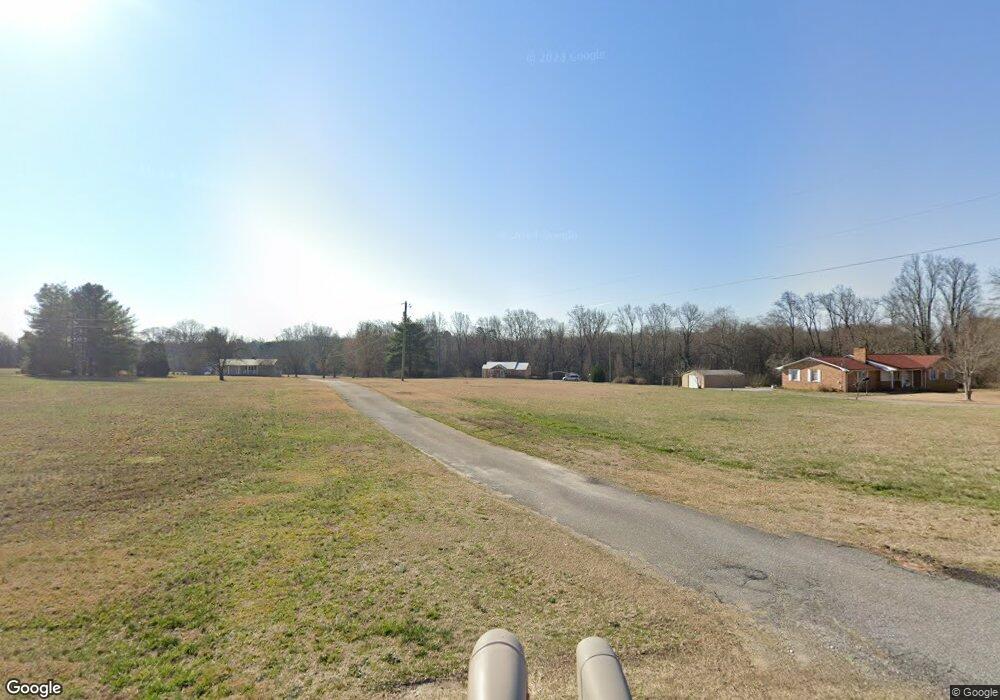
1047 Crumps Rd Hartwell, GA 30643
Estimated Value: $231,518 - $379,000
--
Bed
3
Baths
1,496
Sq Ft
$188/Sq Ft
Est. Value
About This Home
This home is located at 1047 Crumps Rd, Hartwell, GA 30643 and is currently estimated at $281,630, approximately $188 per square foot. 1047 Crumps Rd is a home located in Hart County with nearby schools including Hart County High School.
Ownership History
Date
Name
Owned For
Owner Type
Purchase Details
Closed on
Nov 30, 2021
Sold by
Daniel Gary Darrell
Bought by
Crump Stephanie D
Current Estimated Value
Purchase Details
Closed on
Sep 6, 2017
Sold by
Crump Steven D
Bought by
Crump Stephanie D and Daniel Gary Darrell
Purchase Details
Closed on
Oct 7, 2016
Sold by
Wesley J
Bought by
Crump Steven D and Smith Sharon C
Home Financials for this Owner
Home Financials are based on the most recent Mortgage that was taken out on this home.
Original Mortgage
$80,000
Interest Rate
3.44%
Mortgage Type
New Conventional
Purchase Details
Closed on
Aug 27, 2014
Sold by
Swygert Ashton Leigh
Bought by
Smith Wesley J
Home Financials for this Owner
Home Financials are based on the most recent Mortgage that was taken out on this home.
Original Mortgage
$85,500
Interest Rate
3.34%
Mortgage Type
New Conventional
Create a Home Valuation Report for This Property
The Home Valuation Report is an in-depth analysis detailing your home's value as well as a comparison with similar homes in the area
Home Values in the Area
Average Home Value in this Area
Purchase History
| Date | Buyer | Sale Price | Title Company |
|---|---|---|---|
| Crump Stephanie D | -- | -- | |
| Crump Stephanie D | -- | -- | |
| Crump Stephanie D | $80,000 | -- | |
| Crump Steven D | $80,000 | -- | |
| Smith Wesley J | -- | -- |
Source: Public Records
Mortgage History
| Date | Status | Borrower | Loan Amount |
|---|---|---|---|
| Previous Owner | Crump Steven D | $80,000 | |
| Previous Owner | Smith Wesley J | $85,500 |
Source: Public Records
Tax History Compared to Growth
Tax History
| Year | Tax Paid | Tax Assessment Tax Assessment Total Assessment is a certain percentage of the fair market value that is determined by local assessors to be the total taxable value of land and additions on the property. | Land | Improvement |
|---|---|---|---|---|
| 2024 | $1,012 | $65,510 | $16,387 | $49,123 |
| 2023 | $932 | $55,988 | $14,019 | $41,969 |
| 2022 | $832 | $49,994 | $12,362 | $37,632 |
| 2021 | $768 | $41,417 | $7,143 | $34,274 |
| 2020 | $764 | $39,440 | $6,954 | $32,486 |
| 2019 | $747 | $38,212 | $6,954 | $31,258 |
| 2018 | $760 | $38,446 | $6,954 | $31,492 |
| 2017 | $636 | $38,059 | $6,954 | $31,105 |
| 2016 | $738 | $35,955 | $4,687 | $31,268 |
| 2015 | $672 | $34,498 | $6,005 | $28,493 |
| 2014 | $638 | $32,102 | $4,303 | $27,799 |
| 2013 | -- | $32,523 | $4,303 | $28,220 |
Source: Public Records
Map
Nearby Homes
- 330 Ivy Trail
- 148 Swan Sanders Rd
- 256 Tahoe Dr
- 479 N Point Cir
- 247 N Point Cir
- 251 N Point Cir
- 196 Tony Dr Unit 20
- 196 Tony Dr
- 2375 Reed Creek Hwy
- 21 Creek Stone Dr Unit 2
- 80 Creek Stone Dr
- 36 Creek Stone Dr
- 36 Creek Stone Dr Unit 3
- 80 Creek Stone Dr Unit 5
- 21 Creek Stone Dr
- 0 N Point Cir Unit 7663006
- 0 N Point Cir Unit CL341402
- 0 N Point Cir Unit 10621414
- 2868 Mount Hebron Rd
- 0 Curt Bailey Rd Unit 10576459
- 1047 Crumps Rd
- 977 Crumps Rd
- 1071 Crumps Rd
- 901 Crumps Rd
- 0 Crump Rd
- 1032 Crumps Rd
- 0 Crumps Rd Unit 8633572
- 0 Crumps Rd Unit 8612761
- 0 Crumps Rd Unit 8634534
- 0 Crumps Rd Unit 7100739
- 0 Crumps Rd
- 980 Mount Hebron Rd
- 1272 Mount Hebron Rd
- 1398 Mount Hebron Rd
- 1604 Mount Hebron Rd
- 977 Mount Hebron Rd
- 906 Parham Rd
- 1325 Mount Hebron Rd
- 820 Parham Rd
- 1435 Mount Hebron Rd