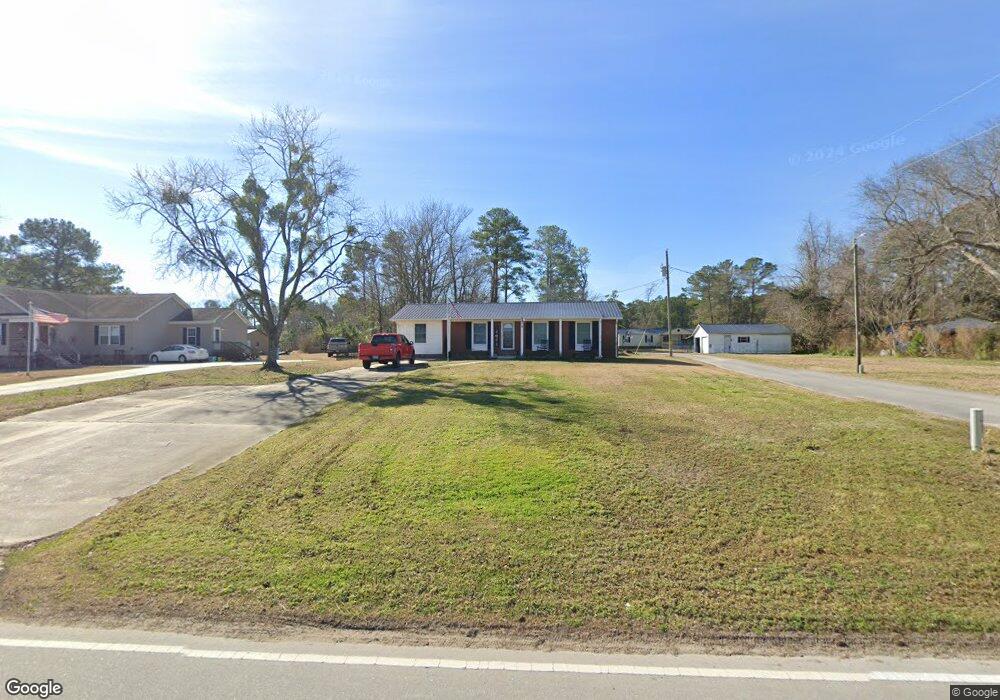
1047 Gregory Fork Rd Richlands, NC 28574
Estimated Value: $170,000 - $204,000
3
Beds
1
Bath
1,375
Sq Ft
$135/Sq Ft
Est. Value
About This Home
This home is located at 1047 Gregory Fork Rd, Richlands, NC 28574 and is currently estimated at $185,282, approximately $134 per square foot. 1047 Gregory Fork Rd is a home located in Onslow County with nearby schools including Richlands Elementary School, Trexler Middle School, and Richlands High School.
Ownership History
Date
Name
Owned For
Owner Type
Purchase Details
Closed on
Mar 25, 2019
Sold by
Houston Steven L and Houston Crystal
Bought by
Humphrey Rodney and Humphrey Cynthia
Current Estimated Value
Purchase Details
Closed on
Aug 8, 2012
Sold by
Houston Juanita Humphrey and Houston Steven
Bought by
Humphrey Rodney E and Humphrey Cynthia Ann
Home Financials for this Owner
Home Financials are based on the most recent Mortgage that was taken out on this home.
Original Mortgage
$100,000
Interest Rate
3.58%
Mortgage Type
Purchase Money Mortgage
Purchase Details
Closed on
Sep 28, 2011
Sold by
Humphrey Rodney Eric and Will Of Theresa Humphrey
Bought by
Houston Juanita Ann and Mills Gloria Jean
Purchase Details
Closed on
Aug 18, 2005
Sold by
Lake Teresa N and Hall Teresa N
Bought by
Shaeffer Clyde and Shaeffer Shirley
Create a Home Valuation Report for This Property
The Home Valuation Report is an in-depth analysis detailing your home's value as well as a comparison with similar homes in the area
Home Values in the Area
Average Home Value in this Area
Purchase History
| Date | Buyer | Sale Price | Title Company |
|---|---|---|---|
| Humphrey Rodney | -- | None Available | |
| Humphrey Rodney E | $100,000 | None Available | |
| Houston Juanita Ann | -- | None Available | |
| Shaeffer Clyde | $83,000 | None Available |
Source: Public Records
Mortgage History
| Date | Status | Borrower | Loan Amount |
|---|---|---|---|
| Previous Owner | Humphrey Rodney E | $100,000 |
Source: Public Records
Tax History Compared to Growth
Tax History
| Year | Tax Paid | Tax Assessment Tax Assessment Total Assessment is a certain percentage of the fair market value that is determined by local assessors to be the total taxable value of land and additions on the property. | Land | Improvement |
|---|---|---|---|---|
| 2025 | $684 | $104,375 | $26,630 | $77,745 |
| 2024 | $684 | $104,375 | $26,630 | $77,745 |
| 2023 | $684 | $104,375 | $26,630 | $77,745 |
| 2022 | $684 | $104,375 | $26,630 | $77,745 |
| 2021 | $639 | $90,580 | $19,530 | $71,050 |
| 2020 | $639 | $90,580 | $19,530 | $71,050 |
| 2019 | $650 | $92,130 | $19,530 | $72,600 |
| 2018 | $650 | $92,130 | $19,530 | $72,600 |
| 2017 | $654 | $96,950 | $19,530 | $77,420 |
| 2016 | $654 | $96,950 | $0 | $0 |
| 2015 | $654 | $96,950 | $0 | $0 |
| 2014 | $654 | $96,950 | $0 | $0 |
Source: Public Records
Map
Nearby Homes
- 1070 Gregory Fork Rd
- 100 Buckhaven Dr
- 113 Woodwater Dr
- 140 Dallas Dr
- 138 Dallas Dr
- 136 Dallas Dr
- 133 Dallas Dr
- 129 Dallas Dr
- 226 Beulaville Hwy
- 200 Classy Ct
- 605 Central Park Way
- 202 Quarry Trail
- 795 Haw Branch Rd
- 101 Loyd Ln
- 580 Koonce Fork Rd
- 225 Mewborn Dr
- Plan 1522 at Waverly Place
- Plan 1830 at Waverly Place
- Plan 2604 at Waverly Place
- Plan 1727 at Waverly Place
- 1043 Gregory Fork Rd
- 1053 Gregory Fork Rd
- 1051 Gregory Fork Rd
- 1057 Gregory Fork Rd
- 1037 Gregory Fork Rd
- 1059 Gregory Fork Rd
- 1036 Gregory Fork Rd
- 1061 Gregory Fork Rd
- 126 Clarence Ln
- 1033 Gregory Fork Rd
- 1027 Gregory Fork Rd
- 1023 Gregory Fork Rd
- 1045 Gregory Fork Rd
- 1073 Gregory Fork Rd
- 1017 Gregory Fork Rd
- 1014 Gregory Fork Rd
- 1079 Gregory Fork Rd
- 1008 Gregory Fork Rd
- 1083 Gregory Fork Rd
- 1010 Gregory Fork Rd