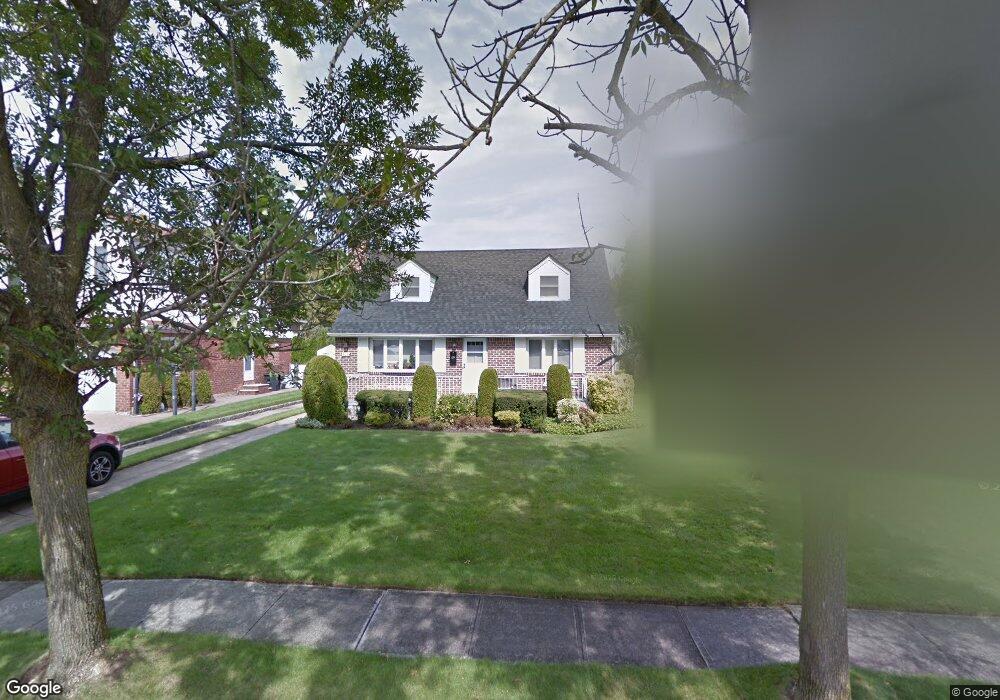
1047 Maple Ln New Hyde Park, NY 11040
Estimated Value: $1,134,000 - $1,323,000
3
Beds
3
Baths
2,170
Sq Ft
$551/Sq Ft
Est. Value
About This Home
This home is located at 1047 Maple Ln, New Hyde Park, NY 11040 and is currently estimated at $1,195,119, approximately $550 per square foot. 1047 Maple Ln is a home located in Nassau County with nearby schools including Herricks High School, Herricks Middle School, and Buckley Country Day School.
Ownership History
Date
Name
Owned For
Owner Type
Purchase Details
Closed on
May 21, 2019
Sold by
Zhou Ding Xing and Lin Yuanli
Bought by
Liao Elva
Current Estimated Value
Home Financials for this Owner
Home Financials are based on the most recent Mortgage that was taken out on this home.
Original Mortgage
$535,000
Outstanding Balance
$466,473
Interest Rate
4.2%
Mortgage Type
New Conventional
Estimated Equity
$728,646
Purchase Details
Closed on
Apr 18, 2011
Sold by
Eredics Rita and Behrens Revocable T Marjorie L
Bought by
Ding Xing Zhou and Ding Joseph
Home Financials for this Owner
Home Financials are based on the most recent Mortgage that was taken out on this home.
Original Mortgage
$300,000
Interest Rate
4.76%
Mortgage Type
Purchase Money Mortgage
Purchase Details
Closed on
Sep 21, 1999
Sold by
Behrens Marjorie L
Bought by
Behrens Marjorie L and Behrens Revocable T Marjorie L
Create a Home Valuation Report for This Property
The Home Valuation Report is an in-depth analysis detailing your home's value as well as a comparison with similar homes in the area
Home Values in the Area
Average Home Value in this Area
Purchase History
| Date | Buyer | Sale Price | Title Company |
|---|---|---|---|
| Liao Elva | $715,000 | None Available | |
| Ding Xing Zhou | $500,000 | -- | |
| Behrens Marjorie L | -- | -- |
Source: Public Records
Mortgage History
| Date | Status | Borrower | Loan Amount |
|---|---|---|---|
| Open | Liao Elva | $535,000 | |
| Previous Owner | Ding Xing Zhou | $300,000 |
Source: Public Records
Tax History
| Year | Tax Paid | Tax Assessment Tax Assessment Total Assessment is a certain percentage of the fair market value that is determined by local assessors to be the total taxable value of land and additions on the property. | Land | Improvement |
|---|---|---|---|---|
| 2025 | $14,027 | $760 | $308 | $452 |
| 2024 | $5,046 | $902 | $365 | $537 |
Source: Public Records
Map
Nearby Homes
Your Personal Tour Guide
Ask me questions while you tour the home.