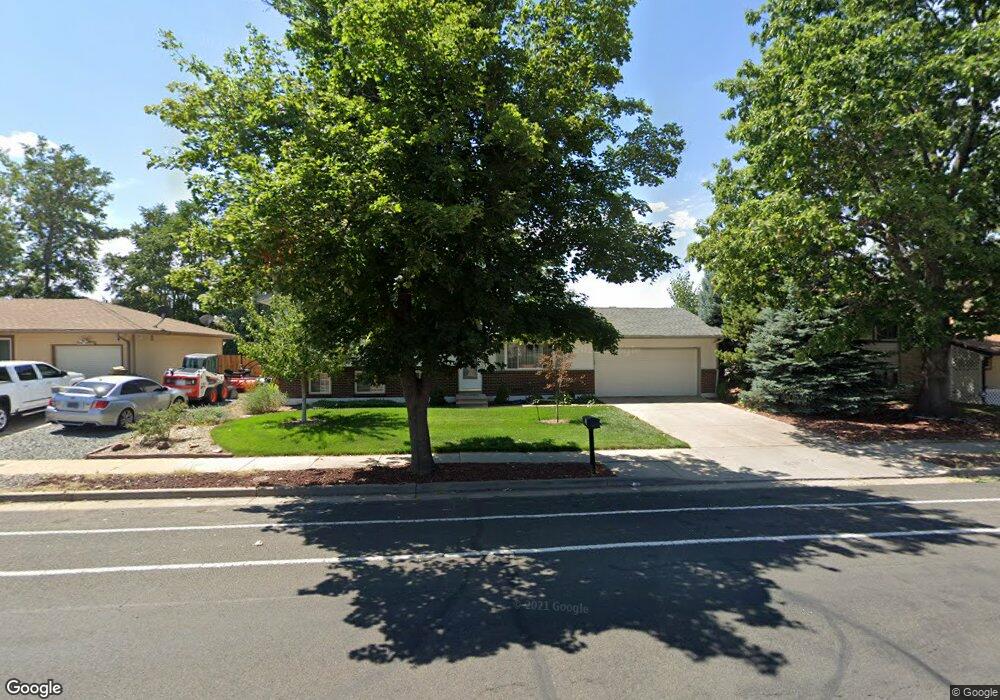
1047 S Moline St Aurora, CO 80012
Expo Park NeighborhoodEstimated Value: $431,655 - $466,000
3
Beds
2
Baths
1,730
Sq Ft
$260/Sq Ft
Est. Value
About This Home
This home is located at 1047 S Moline St, Aurora, CO 80012 and is currently estimated at $450,164, approximately $260 per square foot. 1047 S Moline St is a home located in Arapahoe County with nearby schools including Highline Community Elementary School, Prairie Middle School, and Overland High School.
Ownership History
Date
Name
Owned For
Owner Type
Purchase Details
Closed on
Oct 26, 2012
Sold by
Hodson Danny L and Hodson Beverly R
Bought by
Lemirande Jacob E
Current Estimated Value
Home Financials for this Owner
Home Financials are based on the most recent Mortgage that was taken out on this home.
Original Mortgage
$138,400
Outstanding Balance
$94,854
Interest Rate
3.52%
Mortgage Type
New Conventional
Estimated Equity
$355,310
Purchase Details
Closed on
Dec 1, 1999
Sold by
Stubbings Chris C
Bought by
Hodson Danny L and Hodson Beverly R
Home Financials for this Owner
Home Financials are based on the most recent Mortgage that was taken out on this home.
Original Mortgage
$130,500
Interest Rate
7.93%
Purchase Details
Closed on
Oct 1, 1982
Sold by
Conversion Arapco
Bought by
Conversion Arapco
Purchase Details
Closed on
Jul 4, 1776
Bought by
Conversion Arapco
Create a Home Valuation Report for This Property
The Home Valuation Report is an in-depth analysis detailing your home's value as well as a comparison with similar homes in the area
Home Values in the Area
Average Home Value in this Area
Purchase History
| Date | Buyer | Sale Price | Title Company |
|---|---|---|---|
| Lemirande Jacob E | $173,000 | Land Title Guarantee Company | |
| Hodson Danny L | $145,000 | North American Title Co | |
| Conversion Arapco | -- | -- | |
| Conversion Arapco | -- | -- |
Source: Public Records
Mortgage History
| Date | Status | Borrower | Loan Amount |
|---|---|---|---|
| Open | Lemirande Jacob E | $138,400 | |
| Previous Owner | Hodson Danny L | $130,500 |
Source: Public Records
Tax History
| Year | Tax Paid | Tax Assessment Tax Assessment Total Assessment is a certain percentage of the fair market value that is determined by local assessors to be the total taxable value of land and additions on the property. | Land | Improvement |
|---|---|---|---|---|
| 2025 | $2,333 | $28,994 | -- | -- |
| 2024 | $2,057 | $29,735 | -- | -- |
| 2023 | $2,057 | $29,735 | $0 | $0 |
| 2022 | $1,716 | $23,686 | $0 | $0 |
| 2021 | $1,726 | $23,686 | $0 | $0 |
| 2020 | $1,772 | $24,682 | $0 | $0 |
| 2019 | $1,710 | $24,682 | $0 | $0 |
| 2018 | $1,477 | $20,030 | $0 | $0 |
| 2017 | $1,456 | $20,030 | $0 | $0 |
| 2016 | $1,250 | $16,135 | $0 | $0 |
| 2015 | $1,190 | $16,135 | $0 | $0 |
| 2014 | -- | $8,923 | $0 | $0 |
| 2013 | -- | $11,910 | $0 | $0 |
Source: Public Records
Map
Nearby Homes
- 1090 S Newark St
- 906 S Moline St
- 990 S Kenton St
- 11945 E Ford Dr
- 11955 E Ford Dr
- 809 S Nome St
- 841 S Oakland St
- 12051 E Tennessee Ave
- 12012 E Hoye Dr
- 11335 E Arkansas Ave
- 711 S Moline St
- 719 S Macon Way
- 690 S Newark Ct
- 12083 E Arizona Dr
- 943 S Jamaica St
- 922 S Ironton St
- 912 S Peoria St
- 1011 S Ironton St Unit 306
- 1011 S Ironton St Unit 303
- 1011 S Ironton St Unit 210
- 1037 S Moline St
- 1067 S Moline St
- 1066 S Macon Way
- 1017 S Moline St
- 1076 S Macon Way
- 1077 S Moline St
- 1048 S Moline St
- 1038 S Moline St
- 1046 S Macon Way
- 1058 S Moline St
- 1018 S Moline St
- 1007 S Moline St
- 1086 S Macon Way
- 1087 S Moline St
- 1068 S Moline St
- 986 S Moline St
- 1073 S Macon Way
- 1019 S Newark St
- 1063 S Macon Way
- 1009 S Newark St
Your Personal Tour Guide
Ask me questions while you tour the home.