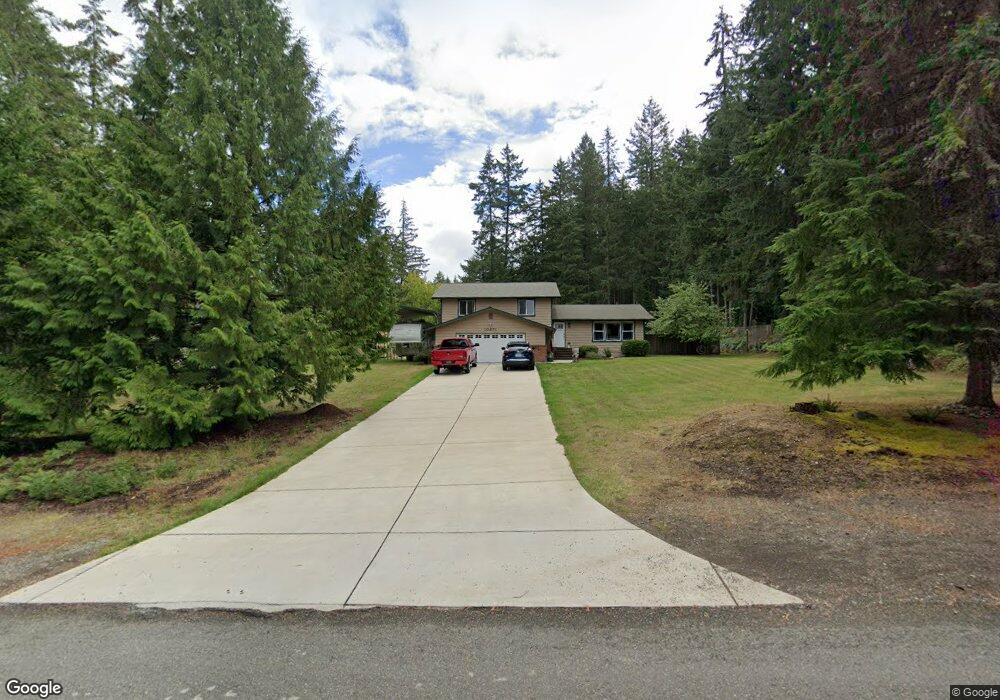
10471 Raintree Place SE Port Orchard, WA 98367
Estimated Value: $618,000 - $713,000
3
Beds
3
Baths
1,910
Sq Ft
$354/Sq Ft
Est. Value
About This Home
This home is located at 10471 Raintree Place SE, Port Orchard, WA 98367 and is currently estimated at $676,425, approximately $354 per square foot. 10471 Raintree Place SE is a home located in Kitsap County with nearby schools including Mullenix Ridge Elementary School, John Sedgwick Middle School, and South Kitsap High School.
Ownership History
Date
Name
Owned For
Owner Type
Purchase Details
Closed on
Oct 13, 2003
Sold by
Smith David H and Smith Jennifer D
Bought by
Maggart Casey M and Maggart Rachelle E
Current Estimated Value
Home Financials for this Owner
Home Financials are based on the most recent Mortgage that was taken out on this home.
Original Mortgage
$178,200
Outstanding Balance
$81,844
Interest Rate
5.98%
Mortgage Type
Purchase Money Mortgage
Estimated Equity
$594,581
Purchase Details
Closed on
Jan 7, 1999
Sold by
Miller Ivan J and Miller Georgia A
Bought by
Smith David H and Smith Jennifer D
Home Financials for this Owner
Home Financials are based on the most recent Mortgage that was taken out on this home.
Original Mortgage
$146,829
Interest Rate
6.66%
Mortgage Type
VA
Purchase Details
Closed on
Nov 5, 1998
Sold by
Miller Ivan James and Miller Georgia Anne
Bought by
Miller Ivan James and Miller Georgia Anne
Create a Home Valuation Report for This Property
The Home Valuation Report is an in-depth analysis detailing your home's value as well as a comparison with similar homes in the area
Home Values in the Area
Average Home Value in this Area
Purchase History
| Date | Buyer | Sale Price | Title Company |
|---|---|---|---|
| Maggart Casey M | $198,000 | Land Title Company | |
| Smith David H | $143,950 | Land Title Company | |
| Miller Ivan James | -- | -- |
Source: Public Records
Mortgage History
| Date | Status | Borrower | Loan Amount |
|---|---|---|---|
| Open | Maggart Casey M | $178,200 | |
| Previous Owner | Smith David H | $146,829 |
Source: Public Records
Tax History Compared to Growth
Tax History
| Year | Tax Paid | Tax Assessment Tax Assessment Total Assessment is a certain percentage of the fair market value that is determined by local assessors to be the total taxable value of land and additions on the property. | Land | Improvement |
|---|---|---|---|---|
| 2026 | $5,190 | $595,270 | $100,660 | $494,610 |
| 2025 | $5,190 | $595,270 | $100,660 | $494,610 |
| 2024 | $5,030 | $594,980 | $100,660 | $494,320 |
| 2023 | $4,998 | $594,980 | $100,660 | $494,320 |
| 2022 | $4,780 | $476,490 | $80,530 | $395,960 |
| 2021 | $4,432 | $417,420 | $71,900 | $345,520 |
| 2020 | $3,564 | $324,260 | $65,750 | $258,510 |
| 2019 | $3,021 | $301,160 | $61,020 | $240,140 |
| 2018 | $3,200 | $245,930 | $55,230 | $190,700 |
| 2017 | $2,719 | $245,930 | $55,230 | $190,700 |
| 2016 | $2,650 | $219,290 | $52,600 | $166,690 |
| 2015 | $2,565 | $215,050 | $52,600 | $162,450 |
| 2014 | -- | $204,000 | $56,270 | $147,730 |
| 2013 | -- | $204,000 | $56,270 | $147,730 |
Source: Public Records
Map
Nearby Homes
- 2797 SE Tucci Place
- 4122 SW Muller Ln Unit 311
- 10379 Bethel Burley Rd SE
- 1627 SE Holman Rd
- 12452 Arab Ln SE
- 8729 Row Ln SE
- 10455 Woodchuck Ln SE
- 9175 Lawrence Dr SE
- 8817 Clearwater Ln SE
- 8964 Lawrence Dr SE
- 11905 Triviere Trail SE
- 8423 Dormar Dr SE
- 0 (Lot 1) SE Spring Creek Rd
- 2569 SE Spring Creek Rd
- 4562 SE Burley Olalla Rd
- 10920 Fairview Blvd SW
- 10532 Olalla Valley Rd SE
- 10102 Fairview Blvd SW
- 10088 Fairview Blvd SW
- 10829 Olalla Valley Rd SE
- 10455 Raintree Place SE
- 10493 Raintree Place SE
- 3064 SE Moon Beam Ct
- 3073 SE Misty Ct
- 3015 SE Misty Ct
- 10488 Raintree Place SE
- 10510 Raintree Place SE
- 10466 Raintree Place SE
- 3005 SE Moon Beam Ct
- 3122 SE Moon Beam Ct
- 10444 Raintree Place SE
- 3063 SE Moon Beam Ct
- 3131 SE Misty Ct
- 10532 Raintree Place SE
- 10422 Raintree Place SE
- 10405 Raintree Place SE
- 3121 SE Moon Beam Ct
- 3180 SE Moon Beam Ct
- 10544 Raintree Place SE
- 3016 SE Misty Ct