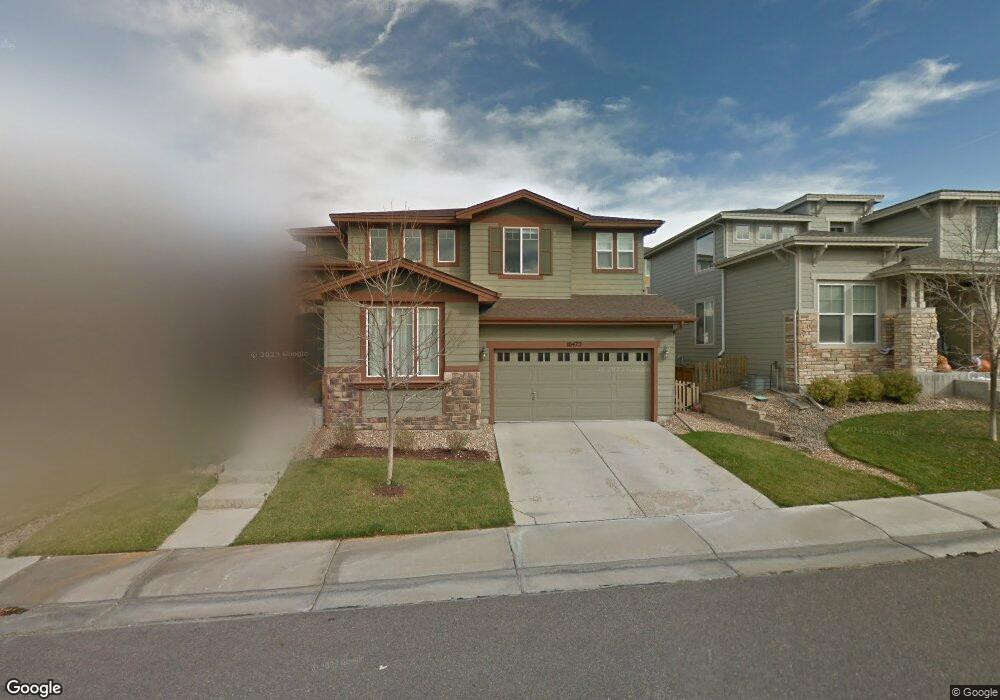
10472 Applebrook Cir Highlands Ranch, CO 80130
Southridge NeighborhoodEstimated Value: $718,471 - $813,000
4
Beds
3
Baths
2,539
Sq Ft
$297/Sq Ft
Est. Value
About This Home
This home is located at 10472 Applebrook Cir, Highlands Ranch, CO 80130 and is currently estimated at $754,118, approximately $297 per square foot. 10472 Applebrook Cir is a home located in Douglas County with nearby schools including Redstone Elementary School, Rocky Heights Middle School, and Rock Canyon High School.
Ownership History
Date
Name
Owned For
Owner Type
Purchase Details
Closed on
Nov 30, 2020
Sold by
Lyons Evan C and Lyons Noel N
Bought by
Brown Danielle C and Ruiz Monica
Current Estimated Value
Home Financials for this Owner
Home Financials are based on the most recent Mortgage that was taken out on this home.
Original Mortgage
$565,000
Outstanding Balance
$503,915
Interest Rate
2.8%
Mortgage Type
VA
Estimated Equity
$250,203
Purchase Details
Closed on
Aug 2, 2005
Sold by
Shea Homes Lp
Bought by
Lyons Evan C and Lyons Noel N
Home Financials for this Owner
Home Financials are based on the most recent Mortgage that was taken out on this home.
Original Mortgage
$276,500
Interest Rate
5.61%
Mortgage Type
Fannie Mae Freddie Mac
Create a Home Valuation Report for This Property
The Home Valuation Report is an in-depth analysis detailing your home's value as well as a comparison with similar homes in the area
Home Values in the Area
Average Home Value in this Area
Purchase History
| Date | Buyer | Sale Price | Title Company |
|---|---|---|---|
| Brown Danielle C | $565,000 | Heritage Title Company | |
| Lyons Evan C | $345,626 | -- |
Source: Public Records
Mortgage History
| Date | Status | Borrower | Loan Amount |
|---|---|---|---|
| Open | Brown Danielle C | $565,000 | |
| Previous Owner | Lyons Evan C | $276,500 |
Source: Public Records
Tax History Compared to Growth
Tax History
| Year | Tax Paid | Tax Assessment Tax Assessment Total Assessment is a certain percentage of the fair market value that is determined by local assessors to be the total taxable value of land and additions on the property. | Land | Improvement |
|---|---|---|---|---|
| 2024 | $4,382 | $50,180 | $9,500 | $40,680 |
| 2023 | $4,374 | $50,180 | $9,500 | $40,680 |
| 2022 | $3,400 | $37,210 | $6,520 | $30,690 |
| 2021 | $3,537 | $37,210 | $6,520 | $30,690 |
| 2020 | $3,293 | $35,510 | $6,190 | $29,320 |
| 2019 | $3,306 | $35,510 | $6,190 | $29,320 |
| 2018 | $3,143 | $33,260 | $5,450 | $27,810 |
| 2017 | $2,862 | $33,260 | $5,450 | $27,810 |
| 2016 | $2,795 | $31,880 | $4,800 | $27,080 |
| 2015 | $2,855 | $31,880 | $4,800 | $27,080 |
| 2014 | $2,603 | $26,840 | $4,620 | $22,220 |
Source: Public Records
Map
Nearby Homes
- 10497 Wagon Box Cir
- 10645 Cedarcrest Cir
- 5639 Jaguar Way
- 10445 Cheetah Winds
- 10660 Jewelberry Cir
- 10439 Cheetah Winds
- 10754 Towerbridge Cir
- 5632 Tory Pointe
- 10557 Jaguar Dr
- 10360 Tracewood Ct
- 6042 Sima Cir
- 10278 Dan Ct
- 10557 Eby Cir
- 4967 Waldenwood Dr
- 4931 Waldenwood Dr
- 10292 Nickolas Ave
- 10541 Jaguar Glen
- 4656 Ketchwood Cir
- 4965 Huntwick Place
- 10547 Laurelglen Cir
- 10474 Applebrook Cir
- 10468 Applebrook Cir
- 10516 Applebrook Cir
- 10512 Applebrook Cir
- 10466 Applebrook Cir
- 10480 Applebrook Cir
- 10524 Applebrook Cir
- 10473 Applebrook Cir
- 10508 Applebrook Cir
- 10475 Applebrook Cir
- 10469 Applebrook Cir
- 10462 Applebrook Cir
- 10528 Applebrook Cir
- 10481 Applebrook Cir
- 10463 Applebrook Cir
- 10460 Applebrook Cir
- 10485 Applebrook Cir
- 10515 Applebrook Cir
- 10532 Applebrook Cir
- 10493 Applebrook Cir