10472 Mill St Trimble, OH 45782
Estimated Value: $64,000 - $82,197
2
Beds
1
Bath
1,099
Sq Ft
$67/Sq Ft
Est. Value
About This Home
This home is located at 10472 Mill St, Trimble, OH 45782 and is currently estimated at $73,099, approximately $66 per square foot. 10472 Mill St is a home with nearby schools including Trimble Elementary School, Trimble Middle School, and Trimble High School.
Ownership History
Date
Name
Owned For
Owner Type
Purchase Details
Closed on
Feb 1, 2021
Sold by
Riley Joshua
Bought by
Graf Bryon
Current Estimated Value
Purchase Details
Closed on
Oct 2, 2018
Sold by
Graf Bryon and Graf Bryon
Bought by
Riley Joshuha
Home Financials for this Owner
Home Financials are based on the most recent Mortgage that was taken out on this home.
Original Mortgage
$40,000
Interest Rate
3.6%
Mortgage Type
Unknown
Purchase Details
Closed on
Oct 19, 2012
Sold by
Brooks William E
Bought by
Hammel Daniel
Purchase Details
Closed on
Dec 5, 2005
Sold by
Bank Of New York
Bought by
Graf Byron and Brooks William E
Purchase Details
Closed on
Jul 25, 2005
Sold by
Smith Phyllis J
Bought by
Bank Of New York
Purchase Details
Closed on
Aug 6, 1993
Sold by
Smith Richard M and Smith Phyllis
Bought by
Smith Phyllis J
Purchase Details
Closed on
Oct 1, 1987
Create a Home Valuation Report for This Property
The Home Valuation Report is an in-depth analysis detailing your home's value as well as a comparison with similar homes in the area
Purchase History
| Date | Buyer | Sale Price | Title Company |
|---|---|---|---|
| Graf Bryon | -- | None Available | |
| Riley Joshuha | $500,000 | None Available | |
| Hammel Daniel | -- | Attorney | |
| Graf Byron | $4,000 | Resource Title Agency Inc | |
| Bank Of New York | $1,667 | None Available | |
| Smith Phyllis J | -- | -- | |
| -- | $13,000 | -- |
Source: Public Records
Mortgage History
| Date | Status | Borrower | Loan Amount |
|---|---|---|---|
| Previous Owner | Riley Joshuha | $40,000 |
Source: Public Records
Tax History
| Year | Tax Paid | Tax Assessment Tax Assessment Total Assessment is a certain percentage of the fair market value that is determined by local assessors to be the total taxable value of land and additions on the property. | Land | Improvement |
|---|---|---|---|---|
| 2024 | $144 | $2,960 | $290 | $2,670 |
| 2023 | $141 | $2,960 | $290 | $2,670 |
| 2022 | $139 | $2,800 | $260 | $2,540 |
| 2021 | $527 | $10,410 | $260 | $10,150 |
| 2020 | $509 | $10,410 | $260 | $10,150 |
| 2019 | $491 | $9,600 | $230 | $9,370 |
| 2018 | $535 | $9,600 | $230 | $9,370 |
| 2017 | $733 | $9,600 | $230 | $9,370 |
| 2016 | $511 | $8,930 | $230 | $8,700 |
| 2015 | $677 | $8,930 | $230 | $8,700 |
| 2014 | $677 | $8,930 | $230 | $8,700 |
| 2013 | $528 | $7,810 | $220 | $7,590 |
Source: Public Records
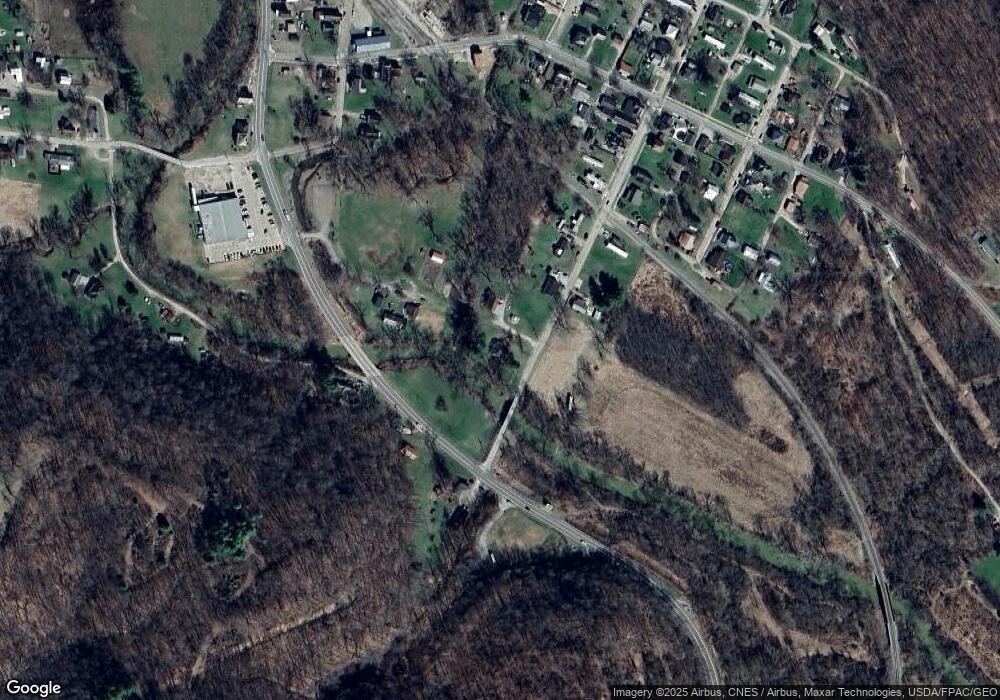
Map
Nearby Homes
- 10473 Mill St
- 10482 Valley St
- 10502 Valley St
- 19397 Lake Dr
- 10605 Sycamore St
- 0 Walnut St
- 19415 Lake Dr
- 19438 Walnut St
- 19427 Maple St
- 19448 Walnut St
- 19457 Walnut St
- 19436 Maple St
- 10589 Valley St
- 25 Congress St
- 19467 Walnut St
- 19457 Maple St
- 19468 Walnut St
- 31 Congress St
- 7 Congress St
- 10588 Valley St
Your Personal Tour Guide
Ask me questions while you tour the home.