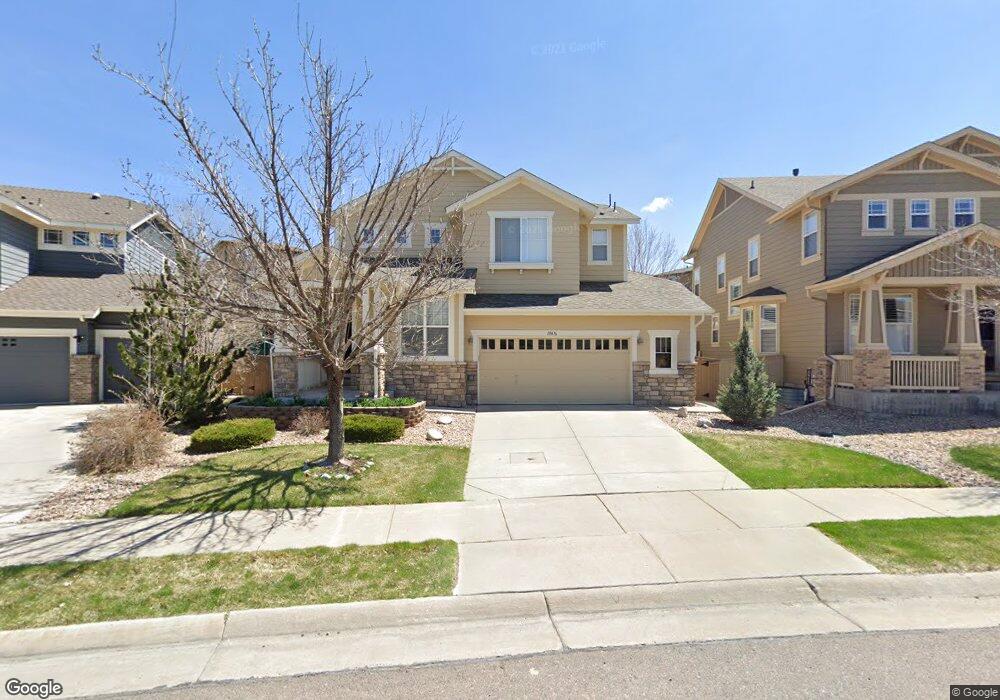
10476 Wagon Box Cir Highlands Ranch, CO 80130
Southridge NeighborhoodEstimated Value: $518,000 - $904,751
4
Beds
4
Baths
3,537
Sq Ft
$225/Sq Ft
Est. Value
About This Home
This home is located at 10476 Wagon Box Cir, Highlands Ranch, CO 80130 and is currently estimated at $796,188, approximately $225 per square foot. 10476 Wagon Box Cir is a home located in Douglas County with nearby schools including Redstone Elementary School, Rocky Heights Middle School, and Rock Canyon High School.
Ownership History
Date
Name
Owned For
Owner Type
Purchase Details
Closed on
Jun 25, 2024
Sold by
Rios Danya S
Bought by
Danya Sol Rios Trust
Current Estimated Value
Purchase Details
Closed on
Sep 29, 2017
Sold by
Schoenbeck Chad A and Schoenbeck Brooke D
Bought by
Rios Billy K and Rios Danya S
Home Financials for this Owner
Home Financials are based on the most recent Mortgage that was taken out on this home.
Original Mortgage
$250,000
Interest Rate
3.92%
Mortgage Type
Future Advance Clause Open End Mortgage
Purchase Details
Closed on
Aug 31, 2004
Sold by
The Ryland Group Inc
Bought by
Schoenbeck Chad A and Schoenbeck Brooke D
Home Financials for this Owner
Home Financials are based on the most recent Mortgage that was taken out on this home.
Original Mortgage
$256,000
Interest Rate
5.97%
Mortgage Type
Unknown
Purchase Details
Closed on
Apr 29, 2003
Sold by
Shea Homes Lp
Bought by
Ryland Group Inc
Create a Home Valuation Report for This Property
The Home Valuation Report is an in-depth analysis detailing your home's value as well as a comparison with similar homes in the area
Home Values in the Area
Average Home Value in this Area
Purchase History
| Date | Buyer | Sale Price | Title Company |
|---|---|---|---|
| Danya Sol Rios Trust | -- | None Listed On Document | |
| Rios Billy K | $575,000 | Prestige Title | |
| Schoenbeck Chad A | $356,688 | Ryland Title Company | |
| Ryland Group Inc | $12,592,000 | -- |
Source: Public Records
Mortgage History
| Date | Status | Borrower | Loan Amount |
|---|---|---|---|
| Previous Owner | Schoenbeck Chad A | $250,000 | |
| Previous Owner | Schoenbeck Chad A | $223,000 | |
| Previous Owner | Schoenbeck Chad A | $229,700 | |
| Previous Owner | Schoenbeck Chad A | $256,000 |
Source: Public Records
Tax History Compared to Growth
Tax History
| Year | Tax Paid | Tax Assessment Tax Assessment Total Assessment is a certain percentage of the fair market value that is determined by local assessors to be the total taxable value of land and additions on the property. | Land | Improvement |
|---|---|---|---|---|
| 2024 | $5,210 | $58,970 | $13,220 | $45,750 |
| 2023 | $5,201 | $58,970 | $13,220 | $45,750 |
| 2022 | $3,916 | $42,860 | $8,850 | $34,010 |
| 2021 | $4,072 | $42,860 | $8,850 | $34,010 |
| 2020 | $3,866 | $41,680 | $8,590 | $33,090 |
| 2019 | $3,880 | $41,680 | $8,590 | $33,090 |
| 2018 | $3,615 | $38,250 | $7,380 | $30,870 |
| 2017 | $3,292 | $38,250 | $7,380 | $30,870 |
| 2016 | $3,204 | $36,540 | $8,690 | $27,850 |
| 2015 | $3,273 | $36,540 | $8,690 | $27,850 |
| 2014 | $2,885 | $29,740 | $5,310 | $24,430 |
Source: Public Records
Map
Nearby Homes
- 10497 Wagon Box Cir
- 10645 Cedarcrest Cir
- 10660 Jewelberry Cir
- 5639 Jaguar Way
- 10754 Towerbridge Cir
- 4965 Huntwick Place
- 10445 Cheetah Winds
- 10360 Tracewood Ct
- 6042 Sima Cir
- 4656 Ketchwood Cir
- 10439 Cheetah Winds
- 10557 Jaguar Dr
- 10547 Laurelglen Cir
- 5632 Tory Pointe
- 11036 Glengate Cir
- 10557 Eby Cir
- 4967 Waldenwood Dr
- 4931 Waldenwood Dr
- 10541 Jaguar Glen
- 5300 Fullerton Ln
- 10474 Wagon Box Cir
- 10480 Wagon Box Cir
- 10484 Wagon Box Cir
- 10472 Wagon Box Cir
- 10473 Wagon Box Cir
- 5319 Applebrook Ln
- 10488 Wagon Box Cir
- 10483 Wagon Box Cir
- 5311 Applebrook Ln
- 10469 Wagon Box Cir
- 5327 Applebrook Ln
- 5301 Applebrook Ln
- 10451 Applebrook Cir
- 10464 Wagon Box Cir
- 5291 Windflower Ln
- 5301 Windflower Ln
- 10492 Wagon Box Cir
- 10489 Wagon Box Cir
- 5289 Windflower Ln
- 10465 Wagon Box Cir