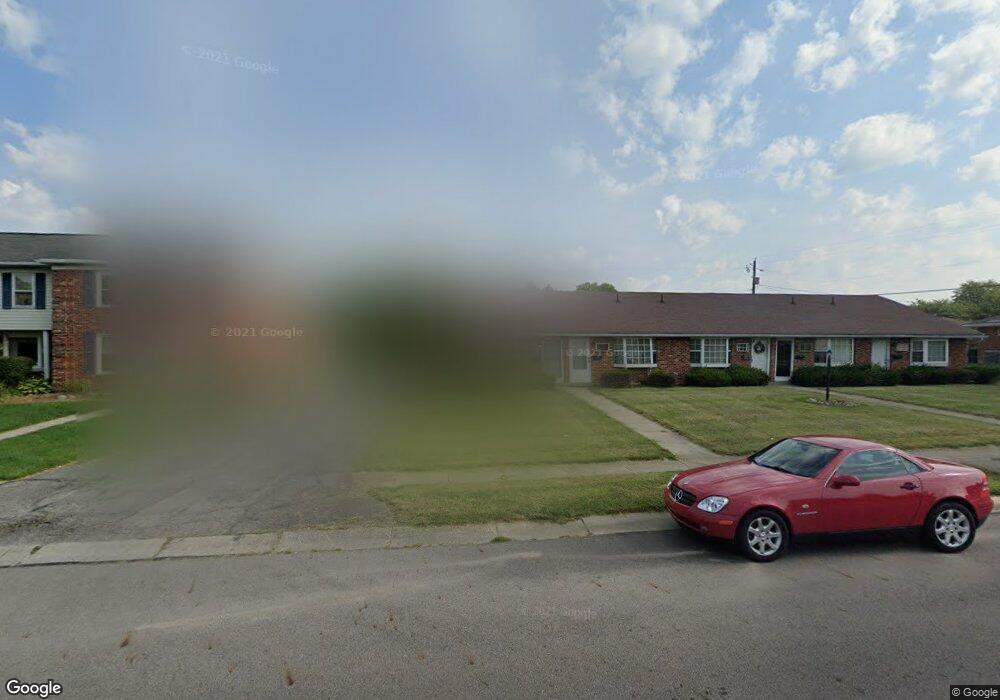
1048 Cheyenne Ave Springfield, OH 45503
Estimated Value: $100,271 - $110,000
1
Bed
1
Bath
636
Sq Ft
$166/Sq Ft
Est. Value
About This Home
This home is located at 1048 Cheyenne Ave, Springfield, OH 45503 and is currently estimated at $105,568, approximately $165 per square foot. 1048 Cheyenne Ave is a home located in Clark County with nearby schools including Rolling Hills Elementary School, Northridge Elementary School, and Northridge Middle School.
Ownership History
Date
Name
Owned For
Owner Type
Purchase Details
Closed on
Aug 10, 2022
Sold by
Judy John C and Judy Lisa G
Bought by
Option C Properties Llc
Current Estimated Value
Home Financials for this Owner
Home Financials are based on the most recent Mortgage that was taken out on this home.
Original Mortgage
$57,750
Outstanding Balance
$52,525
Interest Rate
5.7%
Mortgage Type
New Conventional
Estimated Equity
$53,043
Purchase Details
Closed on
Dec 8, 2008
Sold by
Ackerman Charles A and Ackerman Glenda S
Bought by
Judy John C and Judy Lisa G
Home Financials for this Owner
Home Financials are based on the most recent Mortgage that was taken out on this home.
Original Mortgage
$46,700
Interest Rate
5.87%
Mortgage Type
Purchase Money Mortgage
Create a Home Valuation Report for This Property
The Home Valuation Report is an in-depth analysis detailing your home's value as well as a comparison with similar homes in the area
Home Values in the Area
Average Home Value in this Area
Purchase History
| Date | Buyer | Sale Price | Title Company |
|---|---|---|---|
| Option C Properties Llc | $77,500 | Southward Wayne E | |
| Option C Properties Llc | $77,500 | Southward Wayne E | |
| Judy John C | $52,000 | Attorney |
Source: Public Records
Mortgage History
| Date | Status | Borrower | Loan Amount |
|---|---|---|---|
| Open | Option C Properties Llc | $57,750 | |
| Closed | Option C Properties Llc | $57,750 | |
| Previous Owner | Judy John C | $46,700 |
Source: Public Records
Tax History Compared to Growth
Tax History
| Year | Tax Paid | Tax Assessment Tax Assessment Total Assessment is a certain percentage of the fair market value that is determined by local assessors to be the total taxable value of land and additions on the property. | Land | Improvement |
|---|---|---|---|---|
| 2024 | $952 | $22,020 | $6,830 | $15,190 |
| 2023 | $952 | $22,020 | $6,830 | $15,190 |
| 2022 | $956 | $22,020 | $6,830 | $15,190 |
| 2021 | $845 | $16,500 | $5,250 | $11,250 |
| 2020 | $846 | $16,500 | $5,250 | $11,250 |
| 2019 | $862 | $16,500 | $5,250 | $11,250 |
| 2018 | $883 | $16,210 | $4,940 | $11,270 |
| 2017 | $760 | $16,202 | $4,935 | $11,267 |
| 2016 | $755 | $16,202 | $4,935 | $11,267 |
| 2015 | $828 | $17,126 | $5,250 | $11,876 |
| 2014 | $828 | $17,126 | $5,250 | $11,876 |
| 2013 | $809 | $17,126 | $5,250 | $11,876 |
Source: Public Records
Map
Nearby Homes
- 970 Forest Edge Ave
- 916 Sawmill Ct
- 880 Brendle Trace Unit 28
- 4712 Cullen Ave
- 4622 W Ridgewood Rd
- 4514 Dowden St
- 794 Donnelly Ave
- 1461 Student Ave
- 4109 Derr Rd
- 593 Hiser Ave
- 1139 Greenoak Ct
- 4446 Ridgewood Rd E Unit 3
- 4512 Ridgewood Rd E
- 4438 Tacoma St
- 4740 Merrimont Ave
- 1640 Montego Dr
- 4050 Tacoma St
- 5127 Stoneridge Dr
- 1048 Cheyenne Ave Unit 1048
- 1050 Cheyenne Ave Unit 1050
- 1050 Cheyenne Ave
- 1052 Cheyenne Ave Unit 1052
- 1044 Cheyenne Ave Unit 1044
- 1056 Cheyenne Ave
- 1056 Cheyenne Ave
- 1056 Cheyenne Ave
- 1040 Cheyenne Ave Unit 1040
- 1036 Cheyenne Ave
- 1036 Cheyenne Ave
- 1032 Cheyenne Ave Unit 1032
- 1060 Cheyenne Ave
- 1051 Cheyenne Ave
- 1047 Cheyenne Ave
- 1061 Blaine Ave
- 1024 Cheyenne Ave
- 1053 Cheyenne Ave Unit 1053
- 1045 Cheyenne Ave Unit 1045
- 1045 Cheyenne Ave