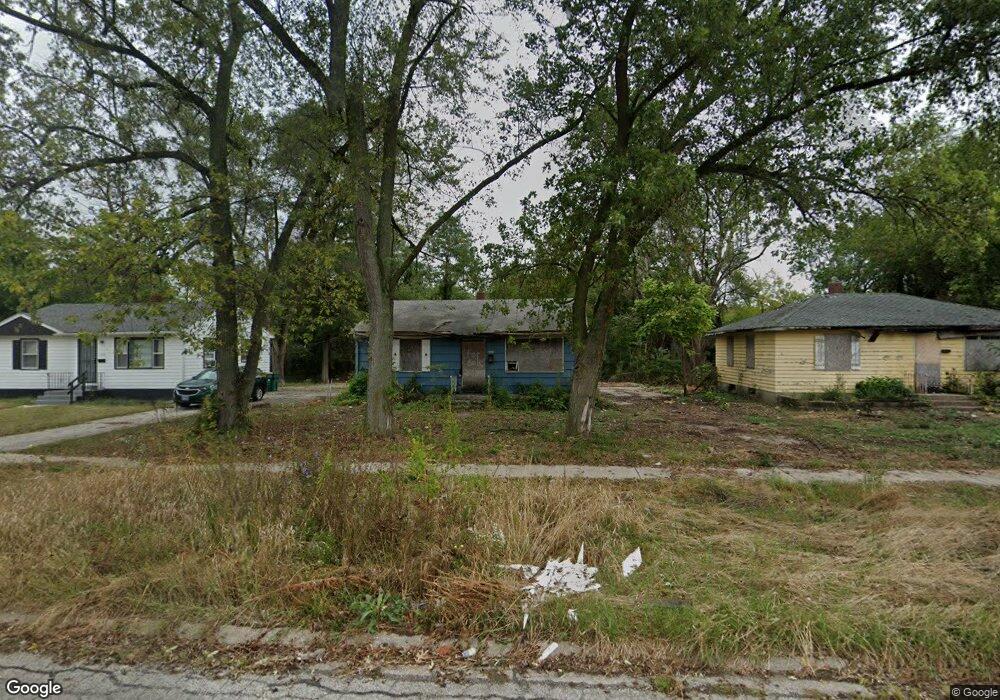
1048 E 49th Ave Gary, IN 46409
Glen Park NeighborhoodEstimated Value: $67,000 - $89,000
2
Beds
1
Bath
816
Sq Ft
$91/Sq Ft
Est. Value
About This Home
This home is located at 1048 E 49th Ave, Gary, IN 46409 and is currently estimated at $74,333, approximately $91 per square foot. 1048 E 49th Ave is a home located in Lake County with nearby schools including Glen Park Academy for Excellence in Learning, Bailly Preparatory Academy, and West Side Leadership Academy.
Ownership History
Date
Name
Owned For
Owner Type
Purchase Details
Closed on
Jul 19, 2024
Sold by
Synergetic Heroes Llc
Bought by
Win-Win Home Sales & Rentals Llc
Current Estimated Value
Purchase Details
Closed on
May 15, 2024
Sold by
Hawkins Realty Group Llc
Bought by
Synergetic Heroes Llc
Purchase Details
Closed on
Sep 6, 2023
Sold by
Synergetic Heroes Llc
Bought by
Hawkin Realty Group Llc
Purchase Details
Closed on
Jun 18, 2023
Sold by
Synergetic Heroes Llc
Bought by
Hawkin Realty Group Llc
Purchase Details
Closed on
Oct 7, 2021
Sold by
Auditor Of Lake County
Bought by
Synergetic Heroes Llc
Purchase Details
Closed on
Jan 25, 2005
Sold by
Cladco Inc
Bought by
Thompson Keon
Home Financials for this Owner
Home Financials are based on the most recent Mortgage that was taken out on this home.
Original Mortgage
$58,500
Interest Rate
8.35%
Mortgage Type
Fannie Mae Freddie Mac
Create a Home Valuation Report for This Property
The Home Valuation Report is an in-depth analysis detailing your home's value as well as a comparison with similar homes in the area
Home Values in the Area
Average Home Value in this Area
Purchase History
| Date | Buyer | Sale Price | Title Company |
|---|---|---|---|
| Win-Win Home Sales & Rentals Llc | $22,500 | None Listed On Document | |
| Synergetic Heroes Llc | -- | None Listed On Document | |
| Hawkin Realty Group Llc | -- | None Listed On Document | |
| Hawkin Realty Group Llc | -- | None Listed On Document | |
| Synergetic Heroes Llc | $500 | None Listed On Document | |
| Thompson Keon | -- | Indiana Title Network Co |
Source: Public Records
Mortgage History
| Date | Status | Borrower | Loan Amount |
|---|---|---|---|
| Previous Owner | Thompson Keon | $58,500 |
Source: Public Records
Tax History
| Year | Tax Paid | Tax Assessment Tax Assessment Total Assessment is a certain percentage of the fair market value that is determined by local assessors to be the total taxable value of land and additions on the property. | Land | Improvement |
|---|---|---|---|---|
| 2025 | $665 | $13,200 | $7,900 | $5,300 |
| 2024 | $1,076 | $12,200 | $7,900 | $4,300 |
| 2023 | $308 | $12,200 | $8,200 | $4,000 |
| 2022 | $254 | $9,900 | $5,800 | $4,100 |
| 2021 | $236 | $9,200 | $5,600 | $3,600 |
| 2020 | $290 | $11,300 | $5,600 | $5,700 |
| 2019 | $1,727 | $11,100 | $5,500 | $5,600 |
| 2018 | $1,512 | $12,300 | $6,100 | $6,200 |
| 2017 | $270 | $12,500 | $6,100 | $6,400 |
| 2016 | $912 | $42,800 | $6,100 | $36,700 |
| 2014 | $1,212 | $51,800 | $7,700 | $44,100 |
| 2013 | $1,130 | $50,300 | $7,700 | $42,600 |
Source: Public Records
Map
Nearby Homes
- 901-1003 E 49th Ave
- 1011 E 47th Place
- 5043 Carolina St
- 636 E 47th Place
- 5042 Virginia St
- 1033 E 51st Place
- 1436 E 51st Ave
- 5049 Indiana Place
- 436 E 47th Place
- 4738 Delaware St
- 4688 Delaware St
- 4641 Delaware St
- 4827 Connecticut St
- 5056 Pennsylvania St
- 4701 Connecticut St
- 4788 Connecticut St
- 4778 Connecticut St
- 5079 Connecticut St
- 809 E 44th Ave
- 4549 Pennsylvania St
- 1038 E 49th Ave
- 1108 E 49th Ave
- 1028 E 49th Ave
- 1120 E 49th Ave
- 1101 E 48th Place
- 1041 E 48th Place
- 1111 E 48th Place
- 4900 Kentucky St
- 1018 E 49th Ave
- 1128 E 49th Ave
- 1121 E 48th Place
- 4901 Kentucky St
- 4901-5 Kentucky St
- 4901-05 Kentucky St
- 4905 Kentucky St
- 1010 E 49th Ave
- 1003 E 49th Ave
- 4920-24 Kentucky St
- 4841 Vermont Place
- 4924 Kentucky St
Your Personal Tour Guide
Ask me questions while you tour the home.