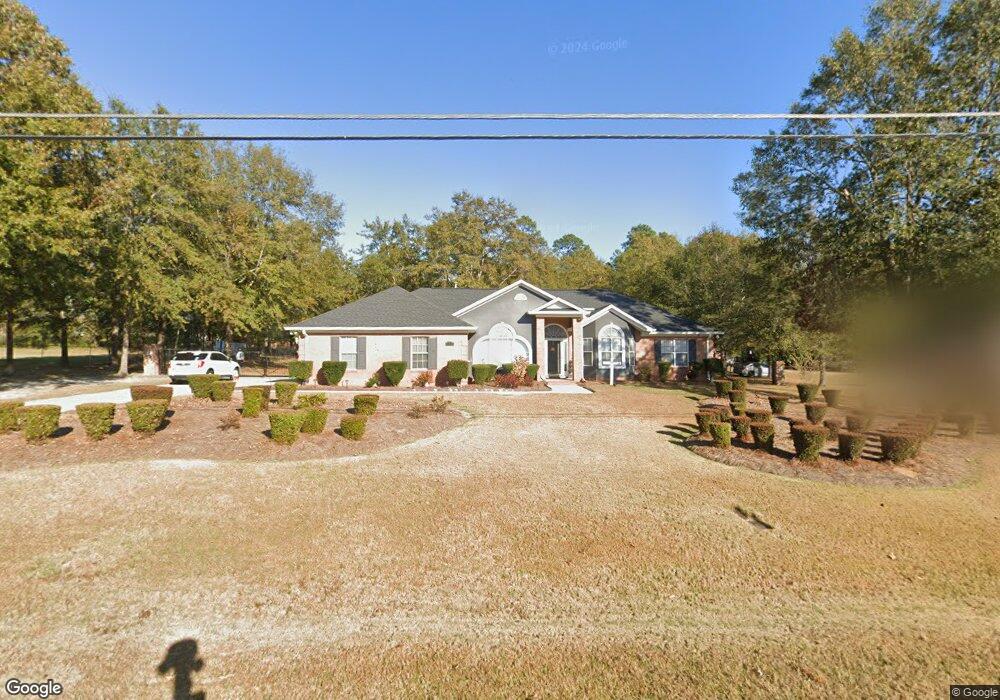
1048 Fox Den Rd Hephzibah, GA 30815
Jamestown NeighborhoodEstimated Value: $249,000 - $316,000
4
Beds
3
Baths
2,465
Sq Ft
$121/Sq Ft
Est. Value
About This Home
This home is located at 1048 Fox Den Rd, Hephzibah, GA 30815 and is currently estimated at $298,194, approximately $120 per square foot. 1048 Fox Den Rd is a home located in Richmond County with nearby schools including Deer Chase Elementary School, Willis Foreman Elementary School, and Hephzibah Middle School.
Ownership History
Date
Name
Owned For
Owner Type
Purchase Details
Closed on
Oct 27, 1994
Sold by
Watson Mitchell Home Builders Inc
Bought by
Goodloe Jarrell L Goodloe Rosana W
Current Estimated Value
Purchase Details
Closed on
Oct 24, 1994
Sold by
Watson Watson and Watson Mitchell Hom
Bought by
Goodloe Jarrell L
Create a Home Valuation Report for This Property
The Home Valuation Report is an in-depth analysis detailing your home's value as well as a comparison with similar homes in the area
Home Values in the Area
Average Home Value in this Area
Purchase History
| Date | Buyer | Sale Price | Title Company |
|---|---|---|---|
| Goodloe Jarrell L Goodloe Rosana W | -- | -- | |
| Goodloe Jarrell L | $147,300 | -- |
Source: Public Records
Tax History Compared to Growth
Tax History
| Year | Tax Paid | Tax Assessment Tax Assessment Total Assessment is a certain percentage of the fair market value that is determined by local assessors to be the total taxable value of land and additions on the property. | Land | Improvement |
|---|---|---|---|---|
| 2025 | $1,387 | $117,760 | $15,920 | $101,840 |
| 2024 | $1,387 | $114,596 | $15,920 | $98,676 |
| 2023 | $1,324 | $103,480 | $15,920 | $87,560 |
| 2022 | $1,246 | $87,135 | $15,920 | $71,215 |
| 2021 | $1,195 | $73,786 | $15,920 | $57,866 |
| 2020 | $1,203 | $73,786 | $15,920 | $57,866 |
| 2019 | $1,260 | $73,786 | $15,920 | $57,866 |
| 2018 | $1,266 | $73,786 | $15,920 | $57,866 |
| 2017 | $1,272 | $73,786 | $15,920 | $57,866 |
| 2016 | $1,266 | $73,203 | $15,920 | $57,283 |
| 2015 | $1,266 | $73,203 | $15,920 | $57,283 |
| 2014 | $1,265 | $73,203 | $15,920 | $57,283 |
Source: Public Records
Map
Nearby Homes
- 1914 Mitchell Place
- 2013 Bassford Dr
- 2213 Riley Ct
- 1855 Beaver Creek Ln
- 1610 Jonathan Place
- 1708 Ethan Way
- 1764 Deer Chase Ln
- 4428 T J Kelly Dr
- 1432 Issac Way
- 3955 Lace Rd
- 3955 Lace Rd Unit D
- 3955 Lace Rd Unit B
- 2160 Kaneck Way
- 2613 Inverness Dr
- 2682 Inverness Dr
- 2686 Inverness Dr
- 2525 Hollington Dr
- 2640 Carrington Dr
- 2690 Inverness Dr
- 2524 Hollington Dr
- 1046 Fox Den Rd
- 1050 Fox Den Rd
- 1126 Fox Den Rd
- 1124 Fox Den Rd
- 1052 Fox Den Rd
- 1128 Fox Den Rd
- 1069 Fox Den Rd
- 1122 Fox Den Rd
- 1044 Fox Den Rd
- 1067 Fox Den Rd
- 1071 Fox Den Rd
- 1042 Fox Den Rd
- 1130 Fox Den Rd
- 1120 Fox Den Rd
- 1054 Fox Den Rd
- 1065 Fox Den Rd
- 1073 Fox Den Rd
- 1118 Fox Den Rd
- 1040 Fox Den Rd
- 1075 Fox Den Rd