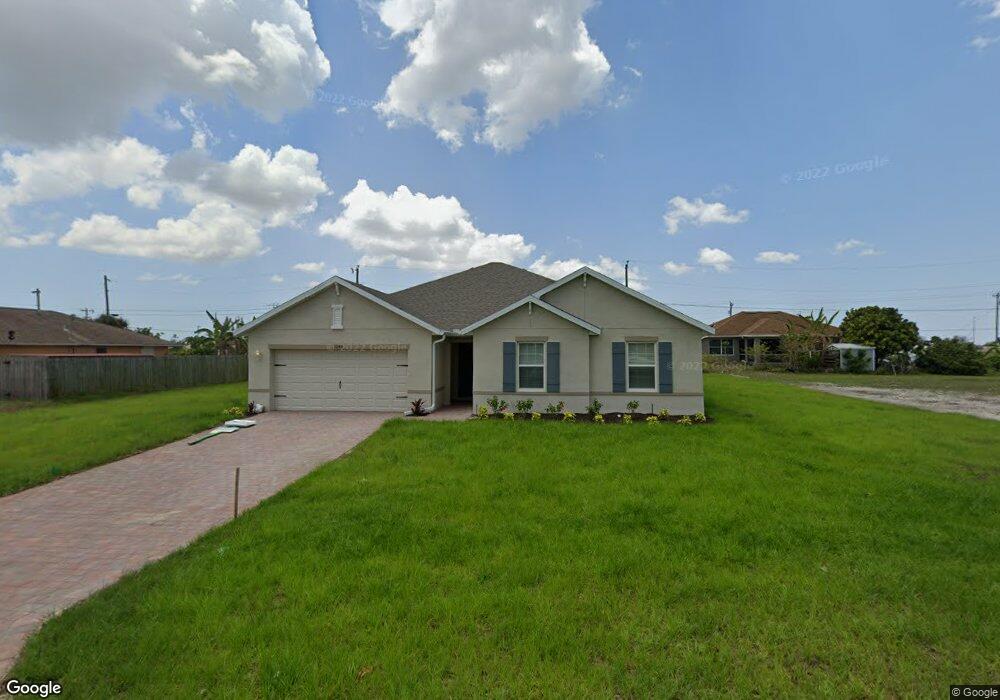
1048 NE 17th Ave Cape Coral, FL 33909
Diplomat NeighborhoodEstimated Value: $362,216 - $446,000
4
Beds
2
Baths
2,223
Sq Ft
$182/Sq Ft
Est. Value
About This Home
This home is located at 1048 NE 17th Ave, Cape Coral, FL 33909 and is currently estimated at $403,554, approximately $181 per square foot. 1048 NE 17th Ave is a home with nearby schools including Caloosa Elementary School, Tropic Isles Elementary School, and Dr. Carrie D. Robinson Littleton Elementary School.
Ownership History
Date
Name
Owned For
Owner Type
Purchase Details
Closed on
Apr 29, 2022
Sold by
Dr Horton Inc
Bought by
Arrias-Mejias Paola Margarita and Hernandez Nelson Orlando
Current Estimated Value
Home Financials for this Owner
Home Financials are based on the most recent Mortgage that was taken out on this home.
Original Mortgage
$3,513,309
Outstanding Balance
$3,296,983
Interest Rate
4.16%
Mortgage Type
FHA
Estimated Equity
-$2,893,429
Purchase Details
Closed on
Feb 4, 2021
Sold by
B & G Landholdings Llc
Bought by
D R Horton Inc
Purchase Details
Closed on
Sep 27, 2017
Sold by
Adam Land Investments Llc
Bought by
The Kingdom Trust Co and William Gillam Cc011830
Purchase Details
Closed on
Jul 1, 2004
Sold by
Luistro Julieta and Luistro Joseph Vincent
Bought by
Adam Land Investment Llc
Purchase Details
Closed on
Feb 23, 1994
Sold by
Santos Abelando R
Bought by
Luistro Julieta O and Luistro Joseph Vincent
Create a Home Valuation Report for This Property
The Home Valuation Report is an in-depth analysis detailing your home's value as well as a comparison with similar homes in the area
Home Values in the Area
Average Home Value in this Area
Purchase History
| Date | Buyer | Sale Price | Title Company |
|---|---|---|---|
| Arrias-Mejias Paola Margarita | $357,790 | Dhi Title Of Florida | |
| D R Horton Inc | $180,000 | Dhi Title Of Florida | |
| B & G Landholdings Llc | $11,000 | Dhi Title Of Florida Inc | |
| The Kingdom Trust Co | $16,650 | Attorney | |
| Adam Land Investment Llc | $35,000 | Avalon Title Inc | |
| Luistro Julieta O | $4,700 | -- |
Source: Public Records
Mortgage History
| Date | Status | Borrower | Loan Amount |
|---|---|---|---|
| Open | Arrias-Mejias Paola Margarita | $3,513,309 |
Source: Public Records
Tax History Compared to Growth
Tax History
| Year | Tax Paid | Tax Assessment Tax Assessment Total Assessment is a certain percentage of the fair market value that is determined by local assessors to be the total taxable value of land and additions on the property. | Land | Improvement |
|---|---|---|---|---|
| 2025 | $5,101 | $313,291 | -- | -- |
| 2024 | $5,101 | $304,462 | $51,297 | $253,165 |
| 2023 | $5,615 | $338,163 | $37,378 | $297,694 |
| 2022 | $1,063 | $10,500 | $10,500 | $0 |
| 2021 | $521 | $10,500 | $10,500 | $0 |
| 2020 | $3,627 | $9,500 | $9,500 | $0 |
| 2019 | $3,644 | $12,000 | $12,000 | $0 |
| 2018 | $3,645 | $12,000 | $12,000 | $0 |
| 2017 | $497 | $12,032 | $12,032 | $0 |
| 2016 | $439 | $8,600 | $8,600 | $0 |
| 2015 | $389 | $6,580 | $6,580 | $0 |
| 2014 | $393 | $6,580 | $6,580 | $0 |
| 2013 | -- | $5,100 | $5,100 | $0 |
Source: Public Records
Map
Nearby Homes
- 1614 NE 12th St
- 1829 NE 10th Terrace
- 1702 NE 10th Terrace
- 1610 NE 12th Terrace
- 1708 NE 12th Terrace
- 1206 NE 18th Ave
- 1116 NE 18th Ave
- 1219 NE 14th Place
- 1818 NE 11th Ln
- 1511 NE 13th St
- 1810 NE 13th Terrace
- 1227 NE 14th Place Unit 15
- 1514 NE 13th Terrace
- 1222 NE 14th Place
- 1819 NE 13th Terrace
- 1823 NE 13th Terrace
- 53 NE Pine Island Rd
- 1214 NE 14th Ave
- 1302 NE 19th Place
- 1202 NE 19th Place
- 1042 NE 17th Ave
- 1045 NE 16th Place
- 1103 NE 16th Place
- 1051 NE 16th Place
- 1700 NE 11th St
- 1704 NE 11th St
- 1703 NE 11th St
- 1041 NE 16th Place
- 1620 NE 10th Ln
- 1102 NE 16th Place
- 1616 NE 10th Terrace
- 1707 NE 10th Ln
- 1624 NE 10th Ln
- 1624 NE 10th Ln
- 1044 NE 16th Place
- 1048 NE 16th Place
- 1707 NE 11th St
- 1040 NE 16th Place
- 1610 NE 12th St
- 1109 NE 16th Place