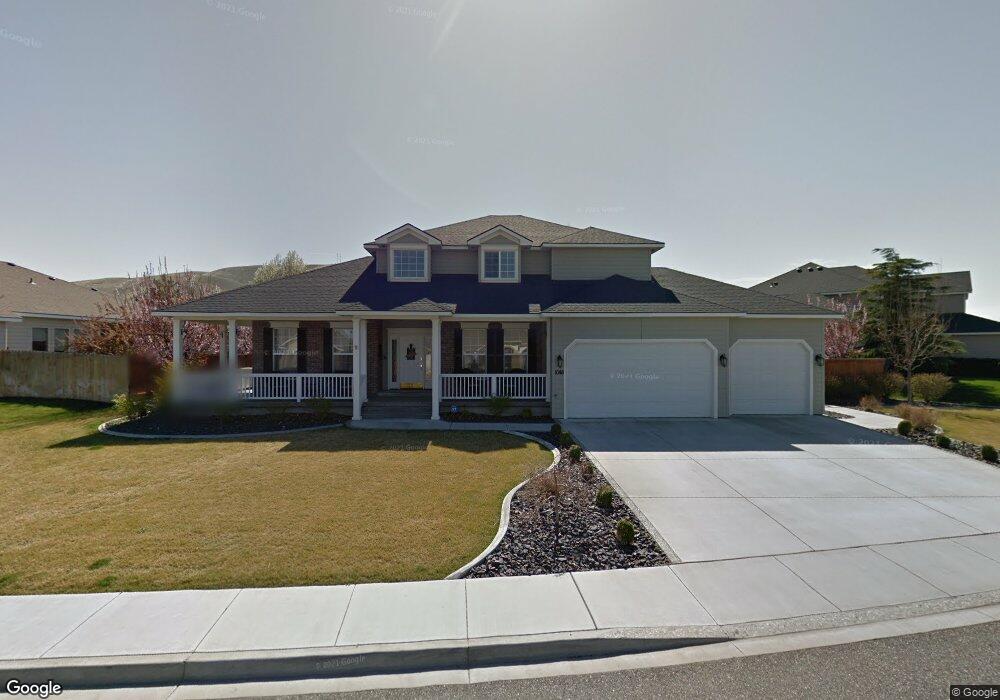
1048 Pattyton Ln Richland, WA 99352
Estimated Value: $564,000 - $654,000
4
Beds
3
Baths
2,502
Sq Ft
$237/Sq Ft
Est. Value
About This Home
This home is located at 1048 Pattyton Ln, Richland, WA 99352 and is currently estimated at $593,087, approximately $237 per square foot. 1048 Pattyton Ln is a home located in Benton County with nearby schools including White Bluffs Elementary School, Enterprise Middle School, and Richland High School.
Ownership History
Date
Name
Owned For
Owner Type
Purchase Details
Closed on
Mar 17, 2022
Sold by
Johns Bruce R and Johns Nancy L
Bought by
Bruce And Nancy Johns Joint Revocable Trust
Current Estimated Value
Purchase Details
Closed on
Oct 3, 2011
Sold by
National Transfer Services Llc
Bought by
Johns Bruce R and Johns Nancy L
Home Financials for this Owner
Home Financials are based on the most recent Mortgage that was taken out on this home.
Original Mortgage
$298,017
Interest Rate
4.16%
Mortgage Type
VA
Purchase Details
Closed on
Oct 12, 2007
Sold by
Bruchman Dan P and Bruchman Candie L
Bought by
Garza Luis R and Garza Karionne
Home Financials for this Owner
Home Financials are based on the most recent Mortgage that was taken out on this home.
Original Mortgage
$234,320
Interest Rate
6.42%
Mortgage Type
Purchase Money Mortgage
Create a Home Valuation Report for This Property
The Home Valuation Report is an in-depth analysis detailing your home's value as well as a comparison with similar homes in the area
Home Values in the Area
Average Home Value in this Area
Purchase History
| Date | Buyer | Sale Price | Title Company |
|---|---|---|---|
| Bruce And Nancy Johns Joint Revocable Trust | -- | -- | |
| Johns Bruce R | $289,900 | Stewart Title Co 1 | |
| National Transfer Services Llc | $289,900 | Stewart Title Co 1 | |
| Garza Luis R | $292,900 | Chicago Title |
Source: Public Records
Mortgage History
| Date | Status | Borrower | Loan Amount |
|---|---|---|---|
| Previous Owner | Johns Bruce R | $298,017 | |
| Previous Owner | Garza Luis R | $234,320 |
Source: Public Records
Tax History Compared to Growth
Tax History
| Year | Tax Paid | Tax Assessment Tax Assessment Total Assessment is a certain percentage of the fair market value that is determined by local assessors to be the total taxable value of land and additions on the property. | Land | Improvement |
|---|---|---|---|---|
| 2024 | $5,061 | $529,070 | $60,000 | $469,070 |
| 2023 | $5,061 | $542,470 | $60,000 | $482,470 |
| 2022 | $4,368 | $421,850 | $60,000 | $361,850 |
| 2021 | $4,093 | $395,050 | $60,000 | $335,050 |
| 2020 | $4,165 | $354,840 | $60,000 | $294,840 |
| 2019 | $3,576 | $341,440 | $60,000 | $281,440 |
| 2018 | $3,689 | $315,120 | $56,000 | $259,120 |
| 2017 | $3,257 | $271,930 | $56,000 | $215,930 |
| 2016 | $3,496 | $271,930 | $56,000 | $215,930 |
| 2015 | $3,551 | $271,930 | $56,000 | $215,930 |
| 2014 | -- | $271,930 | $56,000 | $215,930 |
| 2013 | -- | $271,930 | $56,000 | $215,930 |
Source: Public Records
Map
Nearby Homes
- 3381 Nottingham Dr
- 3529 Hanstead St
- 1222 Country Ridge Dr
- 2581 Jason Loop
- 3629 Nottingham Dr
- 4443 Cowlitz Blvd
- 4228 Cowlitz Blvd
- 4272 Cowlitz Blvd Unit View
- 1120 Tomich Ave
- 4360 Limestone Ct
- 2630 Quarterhorse Way
- 1004 Sirron Ave
- 2618 Quarterhorse Way
- 3680 Keene Rd - Lots 1 2 & 3 Unit 1,2&3
- 4291 Cowlitz Blvd
- 681 Lonetree Ln
- 4361 Cowlitz Blvd
- 677 Lonetree Ln
- 1930 Jericho Rd
- 667 Lonetree Ln
- 1064 Pattyton Ln
- 3302 Nottingham Dr
- 1072 Pattyton Ln
- 3334 Nottingham Dr
- 1043 Pattyton Ln
- 1035 Pattyton Ln
- 1051 Pattyton Ln
- 3350 Nottingham Dr
- 1027 Pattyton Ln
- 1080 Pattyton Ln
- 1075 Pattyton Ln
- 3301 Nottingham Dr
- 1059 Pattyton Ln
- 1067 Pattyton Ln
- 1083 Pattyton Ln
- 1019 Pattyton Ln Unit Stucco Rambler in Br
- 1019 Pattyton Ln Unit Brookshire Estates!!
- 1019 Pattyton Ln
- 3366 Nottingham Dr
- 3317 Nottingham Dr