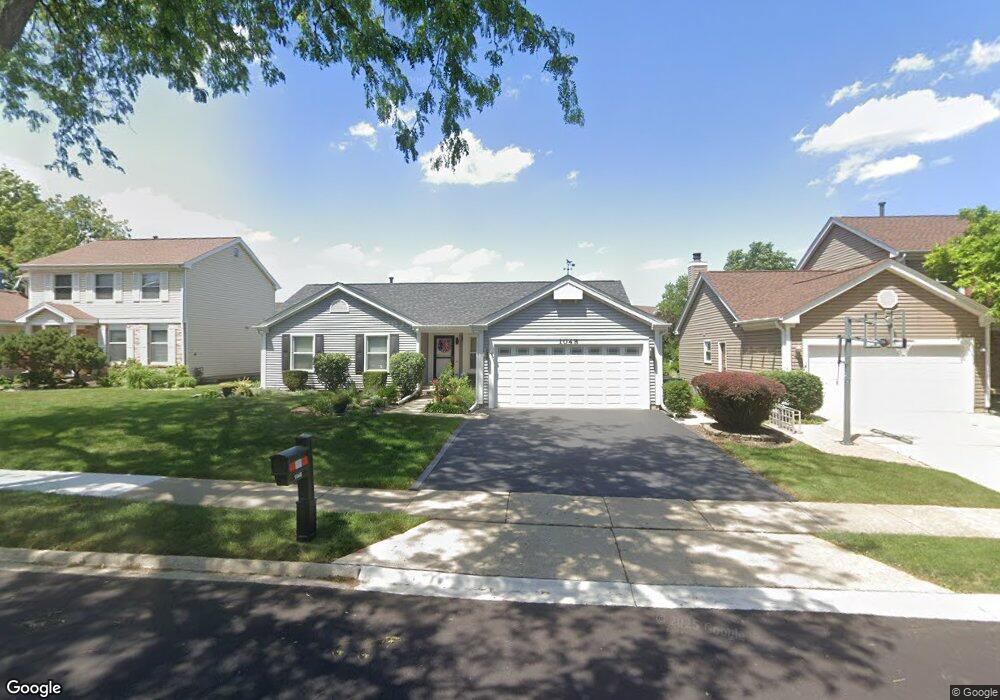
1048 Pear Tree Ln Wheeling, IL 60090
Estimated Value: $425,000 - $467,000
3
Beds
3
Baths
1,487
Sq Ft
$297/Sq Ft
Est. Value
About This Home
This home is located at 1048 Pear Tree Ln, Wheeling, IL 60090 and is currently estimated at $441,606, approximately $296 per square foot. 1048 Pear Tree Ln is a home located in Cook County with nearby schools including Dwight D Eisenhower Elementary School, Anne Sullivan Elementary School, and Betsy Ross Elementary School.
Ownership History
Date
Name
Owned For
Owner Type
Purchase Details
Closed on
Aug 9, 2018
Sold by
Lewis Morgan M and Lewis Patricia L
Bought by
Lewis Patricia L and Patricia L Lewis Trust
Current Estimated Value
Purchase Details
Closed on
Nov 30, 2000
Sold by
Mackie Allan R and Mackie Patricia A
Bought by
Lewis Morgan M and Lewis Patricia
Home Financials for this Owner
Home Financials are based on the most recent Mortgage that was taken out on this home.
Original Mortgage
$70,000
Outstanding Balance
$24,682
Interest Rate
7.83%
Estimated Equity
$416,924
Purchase Details
Closed on
May 15, 1997
Sold by
Neumann Peter E and Neumann Jennifer L
Bought by
Mackie Allan R and Mackie Patricia A
Purchase Details
Closed on
Sep 15, 1993
Sold by
Bartolotta Barbara
Bought by
Neumann Peter E and Neumann Jennifer L
Home Financials for this Owner
Home Financials are based on the most recent Mortgage that was taken out on this home.
Original Mortgage
$133,000
Interest Rate
7.22%
Create a Home Valuation Report for This Property
The Home Valuation Report is an in-depth analysis detailing your home's value as well as a comparison with similar homes in the area
Home Values in the Area
Average Home Value in this Area
Purchase History
| Date | Buyer | Sale Price | Title Company |
|---|---|---|---|
| Lewis Patricia L | -- | None Available | |
| Lewis Morgan M | $255,000 | -- | |
| Mackie Allan R | $225,000 | Attorneys Natl Title Network | |
| Neumann Peter E | $125,333 | -- |
Source: Public Records
Mortgage History
| Date | Status | Borrower | Loan Amount |
|---|---|---|---|
| Open | Lewis Morgan M | $70,000 | |
| Previous Owner | Neumann Peter E | $133,000 |
Source: Public Records
Tax History
| Year | Tax Paid | Tax Assessment Tax Assessment Total Assessment is a certain percentage of the fair market value that is determined by local assessors to be the total taxable value of land and additions on the property. | Land | Improvement |
|---|---|---|---|---|
| 2025 | $8,142 | $38,444 | $8,873 | $29,571 |
| 2024 | $8,142 | $33,353 | $7,508 | $25,845 |
| 2023 | $7,723 | $33,353 | $7,508 | $25,845 |
| 2022 | $7,723 | $33,353 | $7,508 | $25,845 |
| 2021 | $7,974 | $27,408 | $5,118 | $22,290 |
| 2020 | $7,832 | $27,408 | $5,118 | $22,290 |
| 2019 | $7,870 | $30,590 | $5,118 | $25,472 |
| 2018 | $8,312 | $29,549 | $4,436 | $25,113 |
| 2017 | $8,212 | $29,549 | $4,436 | $25,113 |
| 2016 | $7,893 | $29,549 | $4,436 | $25,113 |
| 2015 | $7,100 | $25,057 | $3,924 | $21,133 |
| 2014 | $6,934 | $25,057 | $3,924 | $21,133 |
| 2013 | $6,711 | $25,057 | $3,924 | $21,133 |
Source: Public Records
Map
Nearby Homes
- 448 Bridle Trail Unit 211
- 523 Bridle Trail Unit 161
- 1201 Pleasant Run Dr Unit 312
- 988 Ridgefield Ln Unit 54
- 1111 Pleasant Run Dr Unit 911
- 1125 Pleasant Run Dr Unit 807
- 1105 N Maple Ln
- 1430 Sandstone Dr Unit 202
- 1450 Sandpebble Dr Unit 333
- 1525 Sander Ct Unit 113
- 1550 Sandpebble Dr Unit 209
- 200 Violet Ln
- 751 Garth Rd
- 1033 Wheeling Rd
- 651 Garth Rd
- 802 Andover Ct
- 1211 Highland Dr
- 475 E Merle Ln
- 307 Anne Ct
- 492 Bernice Ct
- 1058 Pear Tree Ln
- 1038 Pear Tree Ln
- 1057 Shady Tree Ln
- 1059 Shady Tree Ln
- 1068 Pear Tree Ln
- 1028 Pear Tree Ln Unit 2
- 1049 Pear Tree Ln
- 1047 Shady Tree Ln
- 1059 Pear Tree Ln
- 1069 Shady Tree Ln
- 1039 Pear Tree Ln
- 1026 Pear Tree Ln
- 1078 Pear Tree Ln
- 1069 Pear Tree Ln
- 1029 Pear Tree Ln
- 1079 Shady Tree Ln
- 1016 Pear Tree Ln
- 1037 Shady Tree Ln
- 1079 Pear Tree Ln
- 1019 Pear Tree Ln
Your Personal Tour Guide
Ask me questions while you tour the home.