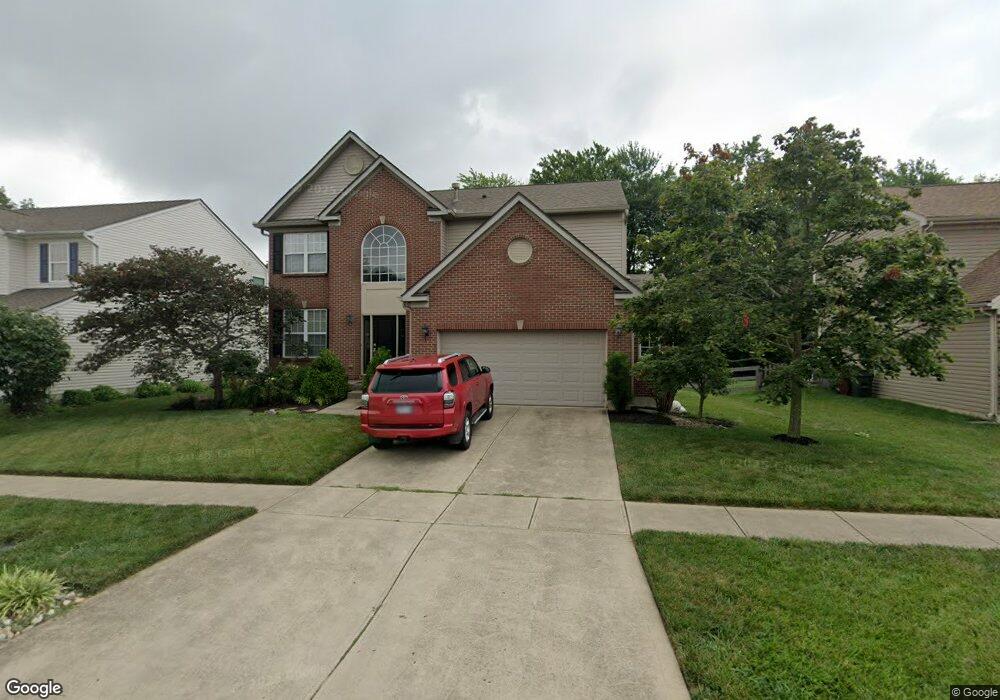
1048 Spruce Glen Morrow, OH 45152
Estimated Value: $405,723 - $444,000
4
Beds
3
Baths
2,342
Sq Ft
$182/Sq Ft
Est. Value
About This Home
This home is located at 1048 Spruce Glen, Morrow, OH 45152 and is currently estimated at $426,681, approximately $182 per square foot. 1048 Spruce Glen is a home located in Warren County with nearby schools including Little Miami Early Childhood Center, Little Miami Intermediate Middle School, and Little Miami Middle School.
Ownership History
Date
Name
Owned For
Owner Type
Purchase Details
Closed on
Mar 27, 2025
Sold by
Crawford Jennifer M and Crawford Michael Reed
Bought by
Reed I Michael I and Reed Jennifer
Current Estimated Value
Home Financials for this Owner
Home Financials are based on the most recent Mortgage that was taken out on this home.
Original Mortgage
$100,000
Outstanding Balance
$99,119
Interest Rate
6.76%
Mortgage Type
Credit Line Revolving
Estimated Equity
$327,562
Purchase Details
Closed on
Dec 3, 2007
Sold by
The Ryland Group Inc
Bought by
Reed Michael and Crawford Jennifer M
Home Financials for this Owner
Home Financials are based on the most recent Mortgage that was taken out on this home.
Original Mortgage
$211,950
Interest Rate
6.33%
Mortgage Type
Purchase Money Mortgage
Purchase Details
Closed on
Apr 24, 2006
Sold by
Towne Development Group Ltd
Bought by
Ryland Group Inc
Create a Home Valuation Report for This Property
The Home Valuation Report is an in-depth analysis detailing your home's value as well as a comparison with similar homes in the area
Home Values in the Area
Average Home Value in this Area
Purchase History
| Date | Buyer | Sale Price | Title Company |
|---|---|---|---|
| Reed I Michael I | $166 | Title Pronto | |
| Reed Michael | $235,566 | Imperial Title | |
| Ryland Group Inc | $275,866 | Ryland Title Company |
Source: Public Records
Mortgage History
| Date | Status | Borrower | Loan Amount |
|---|---|---|---|
| Open | Reed I Michael I | $100,000 | |
| Previous Owner | Reed Michael | $211,950 |
Source: Public Records
Tax History
| Year | Tax Paid | Tax Assessment Tax Assessment Total Assessment is a certain percentage of the fair market value that is determined by local assessors to be the total taxable value of land and additions on the property. | Land | Improvement |
|---|---|---|---|---|
| 2025 | $5,222 | $117,820 | $28,000 | $89,820 |
| 2024 | $5,222 | $117,820 | $28,000 | $89,820 |
| 2023 | $4,589 | $92,393 | $12,915 | $79,478 |
| 2022 | $4,537 | $92,393 | $12,915 | $79,478 |
| 2021 | $4,324 | $92,393 | $12,915 | $79,478 |
| 2020 | $4,118 | $75,117 | $10,500 | $64,617 |
| 2019 | $4,187 | $75,117 | $10,500 | $64,617 |
| 2018 | $4,092 | $75,117 | $10,500 | $64,617 |
| 2017 | $3,369 | $62,024 | $9,177 | $52,847 |
| 2016 | $3,451 | $62,024 | $9,177 | $52,847 |
| 2015 | $3,449 | $62,024 | $9,177 | $52,847 |
| 2014 | $3,894 | $62,020 | $9,180 | $52,850 |
| 2013 | $3,830 | $70,970 | $10,500 | $60,470 |
Source: Public Records
Map
Nearby Homes
- 1065 Dunstan Ct
- 767 Elm Tree Dr
- 723 Grande Oaks Dr
- 792 Oak Forest Dr
- 668 Thornton Dr
- 6535 Abingdon Hall
- 6714 Bedington Ln
- 7000 Quellin Blvd
- 616 Crabapple Ct
- 437 Crossbow Dr
- 5234 Highmeadow Place
- 1497 Wexler Ct
- 1123 Carrington Place
- 5530 Windsor Ct
- 5079 Ross Ridge Rd
- 920 Pondside Ln
- 7078 Quellin Blvd
- 161 Arbor Glen Ct
- 5004 Ross Ridge Rd
- 5004 Ross Ridge
- 1056 Spruce Glen
- 1040 Spruce Glen
- 1064 Spruce Glen
- 6239 Avebury Ct
- 1047 Spruce Glen
- 6235 Avebury Ct
- 1055 Spruce Glen
- 6243 Avebury Ct
- 1041 Spruce Glen
- 1072 Spruce Glen
- 1032 Spruce Glen
- 1063 Spruce Glen
- 1027 Spruce Glen
- 1071 Spruce Glen
- 6247 Avebury Ct
- 6229 Avebury Ct
- 1080 Spruce Glen
- 1024 Spruce Glen
- 1079 Spruce Glen
- 6238 Avebury Ct
Your Personal Tour Guide
Ask me questions while you tour the home.