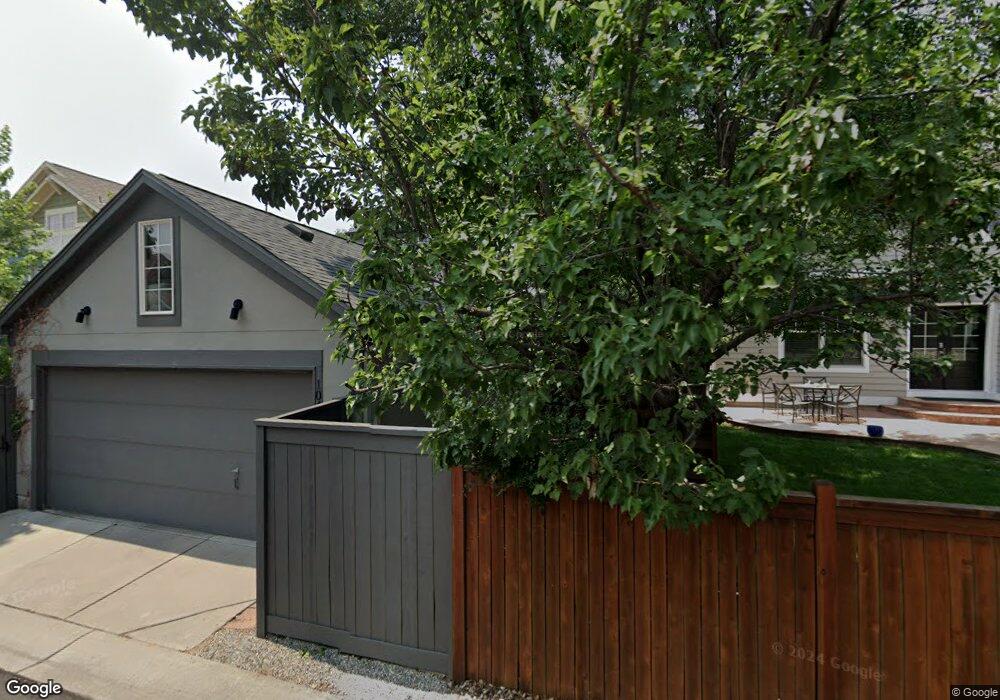
1048 Syracuse St Denver, CO 80230
Lowry NeighborhoodEstimated Value: $924,568 - $1,030,000
3
Beds
3
Baths
3,264
Sq Ft
$298/Sq Ft
Est. Value
About This Home
This home is located at 1048 Syracuse St, Denver, CO 80230 and is currently estimated at $974,142, approximately $298 per square foot. 1048 Syracuse St is a home located in Denver County with nearby schools including Lowry Elementary School, Hill Campus of Arts & Sciences, and George Washington High School.
Ownership History
Date
Name
Owned For
Owner Type
Purchase Details
Closed on
Apr 28, 2025
Sold by
Hintgen David and Hintgen Lisa
Bought by
Hintgen Living Trust
Current Estimated Value
Purchase Details
Closed on
Jul 19, 2013
Sold by
Wilkinson Megan L and Wilkinson John C
Bought by
Hintgen David and Hintgen Lisa
Home Financials for this Owner
Home Financials are based on the most recent Mortgage that was taken out on this home.
Original Mortgage
$370,370
Interest Rate
4.25%
Mortgage Type
FHA
Purchase Details
Closed on
Aug 8, 2003
Sold by
Mcstain Enterprises Inc
Bought by
Wilkinson John C and Wilkinson Megan L
Home Financials for this Owner
Home Financials are based on the most recent Mortgage that was taken out on this home.
Original Mortgage
$322,700
Interest Rate
5.35%
Mortgage Type
Purchase Money Mortgage
Create a Home Valuation Report for This Property
The Home Valuation Report is an in-depth analysis detailing your home's value as well as a comparison with similar homes in the area
Home Values in the Area
Average Home Value in this Area
Purchase History
| Date | Buyer | Sale Price | Title Company |
|---|---|---|---|
| Hintgen Living Trust | -- | None Listed On Document | |
| Hintgen David | $450,000 | Land Title Guarantee Company | |
| Wilkinson John C | $440,525 | Land Title Guarantee Company |
Source: Public Records
Mortgage History
| Date | Status | Borrower | Loan Amount |
|---|---|---|---|
| Previous Owner | Hintgen David | $370,370 | |
| Previous Owner | Wilkinson John C | $322,700 | |
| Closed | Wilkinson John C | $73,700 |
Source: Public Records
Tax History Compared to Growth
Tax History
| Year | Tax Paid | Tax Assessment Tax Assessment Total Assessment is a certain percentage of the fair market value that is determined by local assessors to be the total taxable value of land and additions on the property. | Land | Improvement |
|---|---|---|---|---|
| 2024 | $4,875 | $61,550 | $9,430 | $52,120 |
| 2023 | $4,769 | $61,550 | $9,430 | $52,120 |
| 2022 | $4,049 | $50,910 | $10,580 | $40,330 |
| 2021 | $3,908 | $52,380 | $10,890 | $41,490 |
| 2020 | $3,723 | $50,180 | $10,890 | $39,290 |
| 2019 | $3,619 | $50,180 | $10,890 | $39,290 |
| 2018 | $3,527 | $45,590 | $9,400 | $36,190 |
| 2017 | $3,517 | $45,590 | $9,400 | $36,190 |
| 2016 | $3,414 | $41,860 | $10,388 | $31,472 |
| 2015 | $3,270 | $41,860 | $10,388 | $31,472 |
| 2014 | $3,038 | $36,580 | $6,265 | $30,315 |
Source: Public Records
Map
Nearby Homes
- 7632 E 8th Place
- 1150 Rosemary St
- 7551 E 8th Ave
- 1000 Ulster St
- 1187 Syracuse St
- 1067 Uinta Way Unit 1067
- 7337 E 10th Ave
- 7362 E 8th Place
- 1238 Rosemary St
- 7846 E Severn Place
- 1300 Spruce St
- 1256 Ulster St
- 1285 Roslyn St
- 1272 Ulster St
- 903 Poplar St
- 1100 Pontiac St
- 1271 Uinta St
- 8200 E 8th Ave Unit 203
- 8200 E 8th Ave Unit 1203
- 1264 Uinta St
- 1028 Syracuse St
- 1068 Syracuse St
- 1008 Syracuse St
- 1088 Syracuse St
- 1029 Syracuse Ct
- 1049 Syracuse Ct
- 998 Syracuse St
- 1069 Syracuse Ct
- 1089 Syracuse Ct
- 1098 Syracuse St
- 1047 Syracuse St
- 1009 Syracuse Ct
- 1099 Syracuse Ct
- 968 Syracuse St
- 1027 Syracuse St
- 1067 Syracuse St
- 999 Syracuse Ct
- 1007 Syracuse St
- 1095 Syracuse Ct
- 1087 Syracuse St